
Primary energy imports have declined by about 34% since the peak reached in 2007. During this same period, exports of primary energy have more than doubled. The combination of decreasing imports and rising exports of primary energy have resulted in the lowest net imports (difference between imports and exports) since 1986.
Primary Energy Imports and Exports, 1950-2014
Image
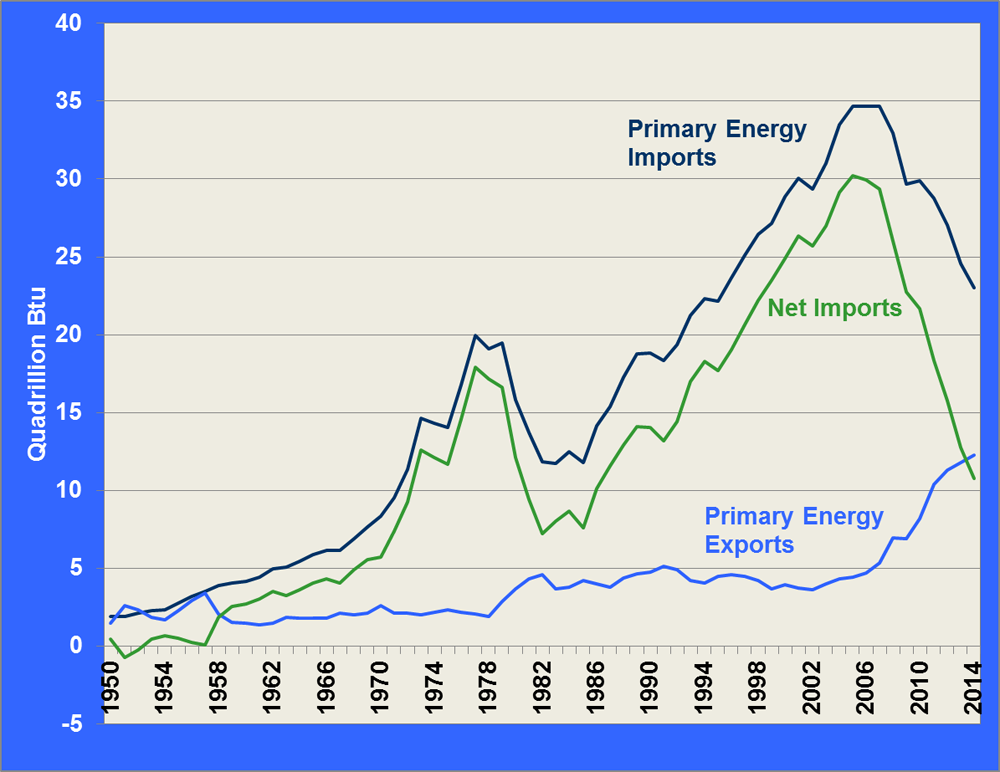
Note: Primary energy includes coal, coal coke, petroleum, natural gas, biofuels and electricity. To see imports of petroleum only, see Fact #837.
Supporting Information
Imports and Exports of Primary Energy, 1950-2014
(Quadrillion Btu)
| Year | Primary Energy Imports | Primary Energy Exports | Net Energy Imports |
|---|---|---|---|
| 1950 | 1.91 | 1.47 | 0.45 |
| 1951 | 1.89 | 2.62 | -0.73 |
| 1952 | 2.15 | 2.37 | -0.22 |
| 1953 | 2.31 | 1.87 | 0.45 |
| 1954 | 2.35 | 1.70 | 0.65 |
| 1955 | 2.79 | 2.29 | 0.50 |
| 1956 | 3.21 | 2.95 | 0.26 |
| 1957 | 3.53 | 3.44 | 0.09 |
| 1958 | 3.88 | 2.05 | 1.83 |
| 1959 | 4.08 | 1.53 | 2.54 |
| 1960 | 4.19 | 1.48 | 2.71 |
| 1961 | 4.44 | 1.38 | 3.06 |
| 1962 | 4.99 | 1.47 | 3.52 |
| 1963 | 5.09 | 1.84 | 3.25 |
| 1964 | 5.45 | 1.81 | 3.63 |
| 1965 | 5.89 | 1.83 | 4.06 |
| 1966 | 6.15 | 1.83 | 4.32 |
| 1967 | 6.16 | 2.12 | 4.04 |
| 1968 | 6.91 | 2.00 | 4.91 |
| 1969 | 7.68 | 2.13 | 5.55 |
| 1970 | 8.34 | 2.63 | 5.71 |
| 1971 | 9.53 | 2.15 | 7.38 |
| 1972 | 11.39 | 2.12 | 9.27 |
| 1973 | 14.61 | 2.03 | 12.58 |
| 1974 | 14.30 | 2.20 | 12.10 |
| 1975 | 14.03 | 2.32 | 11.71 |
| 1976 | 16.76 | 2.17 | 14.59 |
| 1977 | 19.95 | 2.05 | 17.90 |
| 1978 | 19.11 | 1.92 | 17.19 |
| 1979 | 19.46 | 2.86 | 16.60 |
| 1980 | 15.80 | 3.69 | 12.10 |
| 1981 | 13.72 | 4.31 | 9.41 |
| 1982 | 11.86 | 4.61 | 7.25 |
| 1983 | 11.75 | 3.69 | 8.06 |
| 1984 | 12.47 | 3.79 | 8.68 |
| 1985 | 11.78 | 4.20 | 7.58 |
| 1986 | 14.15 | 4.02 | 10.13 |
| 1987 | 15.40 | 3.81 | 11.59 |
| 1988 | 17.30 | 4.37 | 12.93 |
| 1989 | 18.77 | 4.66 | 14.11 |
| 1990 | 18.82 | 4.75 | 14.06 |
| 1991 | 18.33 | 5.14 | 13.19 |
| 1992 | 19.37 | 4.94 | 14.44 |
| 1993 | 21.22 | 4.23 | 16.99 |
| 1994 | 22.31 | 4.04 | 18.27 |
| 1995 | 22.18 | 4.50 | 17.68 |
| 1996 | 23.63 | 4.61 | 19.02 |
| 1997 | 25.12 | 4.49 | 20.63 |
| 1998 | 26.47 | 4.24 | 22.24 |
| 1999 | 27.15 | 3.67 | 23.48 |
| 2000 | 28.87 | 3.96 | 24.90 |
| 2001 | 30.05 | 3.73 | 26.32 |
| 2002 | 29.33 | 3.61 | 25.72 |
| 2003 | 31.01 | 4.01 | 26.99 |
| 2004 | 33.49 | 4.35 | 29.14 |
| 2005 | 34.66 | 4.46 | 30.20 |
| 2006 | 34.65 | 4.73 | 29.92 |
| 2007 | 34.68 | 5.34 | 29.34 |
| 2008 | 32.97 | 6.95 | 26.02 |
| 2009 | 29.69 | 6.92 | 22.77 |
| 2010 | 29.87 | 8.18 | 21.69 |
| 2011 | 28.75 | 10.38 | 18.37 |
| 2012 | 27.06 | 11.28 | 15.78 |
| 2013 | 24.59 | 11.81 | 12.77 |
| 2014 | 23.01 | 12.25 | 10.76 |
Note: December 2014 data were estimated. | |||