
Net imports of petroleum (total imports minus exports) were 6.2 million barrels per day in 2013 – the lowest since the 1980's (dark blue line). The widening gap between total imports (light blue line) and net imports (dark blue line) is due to an increase in exports of petroleum and petroleum products in recent years. Total imports, net imports, and U.S. petroleum consumption all peaked in 2005 and have generally declined since then.
U.S. Petroleum Consumption, Total Imports, and Net Imports, 1950-2013
Image
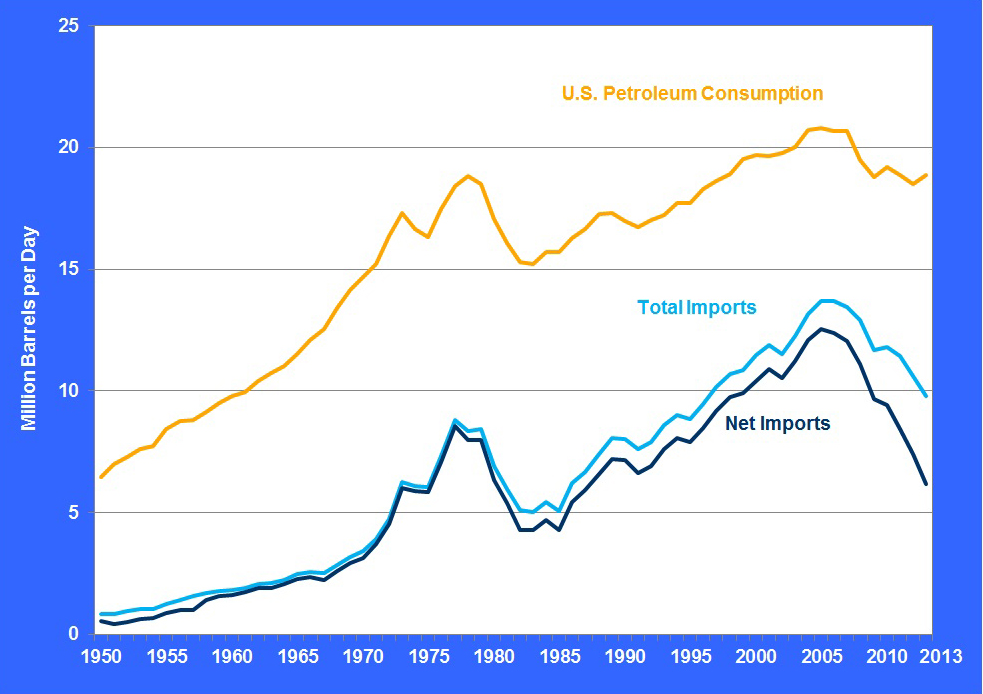
Note: Net imports are equal to total imports minus exports.
Supporting Information
| Year | Total Imports of Petroleum | Net Imports of Petroleum | U.S. Consumption of Petroleum |
|---|---|---|---|
| (Million barrels per day) | |||
| 1950 | 0.85 | 0.55 | 6.46 |
| 1951 | 0.84 | 0.42 | 7.02 |
| 1952 | 0.95 | 0.52 | 7.27 |
| 1953 | 1.03 | 0.63 | 7.60 |
| 1954 | 1.05 | 0.70 | 7.76 |
| 1955 | 1.25 | 0.88 | 8.46 |
| 1956 | 1.44 | 1.01 | 8.78 |
| 1957 | 1.57 | 1.01 | 8.81 |
| 1958 | 1.70 | 1.42 | 9.12 |
| 1959 | 1.78 | 1.57 | 9.53 |
| 1960 | 1.81 | 1.61 | 9.80 |
| 1961 | 1.92 | 1.74 | 9.98 |
| 1962 | 2.08 | 1.91 | 10.40 |
| 1963 | 2.12 | 1.91 | 10.74 |
| 1964 | 2.26 | 2.06 | 11.02 |
| 1965 | 2.47 | 2.28 | 11.51 |
| 1966 | 2.57 | 2.37 | 12.08 |
| 1967 | 2.54 | 2.23 | 12.56 |
| 1968 | 2.84 | 2.61 | 13.39 |
| 1969 | 3.17 | 2.93 | 14.14 |
| 1970 | 3.42 | 3.16 | 14.70 |
| 1971 | 3.93 | 3.70 | 15.21 |
| 1972 | 4.74 | 4.52 | 16.37 |
| 1973 | 6.26 | 6.02 | 17.31 |
| 1974 | 6.11 | 5.89 | 16.65 |
| 1975 | 6.06 | 5.85 | 16.32 |
| 1976 | 7.31 | 7.09 | 17.46 |
| 1977 | 8.81 | 8.56 | 18.43 |
| 1978 | 8.36 | 8.00 | 18.85 |
| 1979 | 8.46 | 7.99 | 18.51 |
| 1980 | 6.91 | 6.36 | 17.06 |
| 1981 | 6.00 | 5.40 | 16.06 |
| 1982 | 5.11 | 4.30 | 15.30 |
| 1983 | 5.05 | 4.31 | 15.23 |
| 1984 | 5.44 | 4.72 | 15.73 |
| 1985 | 5.07 | 4.29 | 15.73 |
| 1986 | 6.22 | 5.44 | 16.28 |
| 1987 | 6.68 | 5.91 | 16.67 |
| 1988 | 7.40 | 6.59 | 17.28 |
| 1989 | 8.06 | 7.20 | 17.33 |
| 1990 | 8.02 | 7.16 | 16.99 |
| 1991 | 7.63 | 6.63 | 16.71 |
| 1992 | 7.89 | 6.94 | 17.03 |
| 1993 | 8.62 | 7.62 | 17.24 |
| 1994 | 9.00 | 8.05 | 17.72 |
| 1995 | 8.83 | 7.89 | 17.72 |
| 1996 | 9.48 | 8.50 | 18.31 |
| 1997 | 10.16 | 9.16 | 18.62 |
| 1998 | 10.71 | 9.76 | 18.92 |
| 1999 | 10.85 | 9.91 | 19.52 |
| 2000 | 11.46 | 10.42 | 19.70 |
| 2001 | 11.87 | 10.90 | 19.65 |
| 2002 | 11.53 | 10.55 | 19.76 |
| 2003 | 12.26 | 11.24 | 20.03 |
| 2004 | 13.15 | 12.10 | 20.73 |
| 2005 | 13.71 | 12.55 | 20.80 |
| 2006 | 13.71 | 12.39 | 20.69 |
| 2007 | 13.47 | 12.04 | 20.68 |
| 2008 | 12.92 | 11.11 | 19.50 |
| 2009 | 11.69 | 9.67 | 18.77 |
| 2010 | 11.79 | 9.44 | 19.18 |
| 2011 | 11.44 | 8.45 | 18.88 |
| 2012 | 10.60 | 7.39 | 18.49 |
| 2013 | 9.79 | 6.20 | 18.89 |
| Source: U.S. Department of Energy, Energy Information Administration, Monthly Energy Review, August 2014, Table 3.3a. | |||