A new study from Lawrence Berkeley National Laboratory published in the journal iScience uses a new methodology to predict patterns for utility-scale wind and solar energy costs and concludes that they will progressively decline in the coming years.
Wind Energy Technologies Office
October 17, 2022Projections of the future cost of wind and solar power generation can help inform investments and power sector planning. But accurately projecting the future cost of renewable generation is challenging. One commonly used method—learning curves—holds that for each doubling of deployment, costs fall by a certain percentage, known as the learning rate. The learning rate is derived from the historical relationship between cost and deployment and can be applied to deployment projections to estimate future costs.
Past learning curve studies have often focused on the upfront installed cost of wind and solar. But installed cost is just one of a handful of inputs—including operating costs, financing cost, and annual energy production—that affect the levelized cost of energy (LCOE) generated, and each of these cost components can benefit from learning.
In a new study published in the journal iScience, Lawrence Berkeley National Laboratory researchers Mark Bolinger, Ryan Wiser, and Eric O’Shaughnessy improve upon past learning curves for utility-scale wind and solar through a combination of approaches. First, drawing on Berkeley Lab’s extensive utility-scale wind and solar plant databases, they calculate plant-level LCOE estimates over time, and then use LCOE, rather than installed costs, to assess historical learning curves. Second, they normalize LCOE to control for, or remove, external influences that are unrelated to learning. Finally, they employ techniques to identify how learning has varied over time.
Figure 1 shows the raw and normalized LCOE history of both wind and solar. These curves represent annual averages of LCOE for the majority of wind and solar plants built in the United States through 2020.
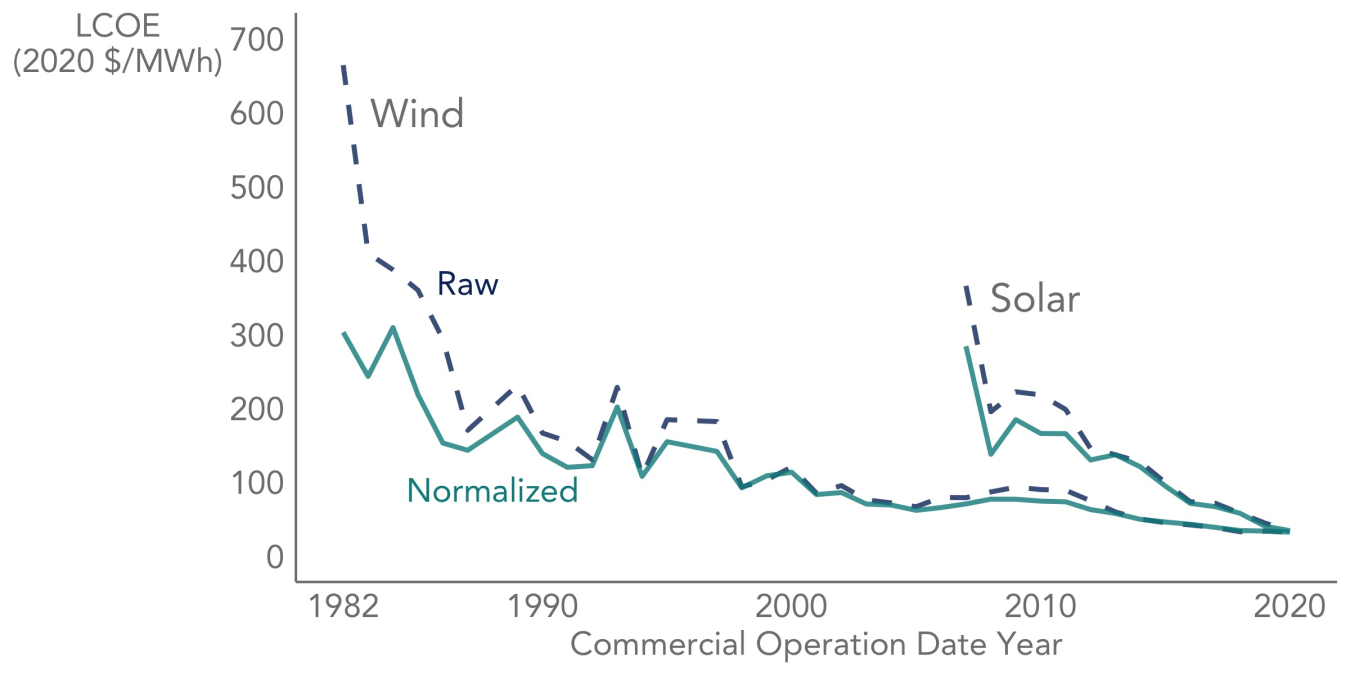
Figure 1. Annual average raw and normalized LCOE (in U.S. dollars [$] per megawatt-hour [MWh]) of wind and solar power in the United States.
“One important thing that we bring to the table is extensive empirical cost and performance data for individual wind and solar plants,” Bolinger said. “This granularity not only enables us to estimate plant-level LCOE for most of the U.S. fleet, but also allows us to filter out certain external LCOE influences to better separate the learning signal from the noise.”
The normalized curves in Figure 1 control for variation in geography, exchange rates, finance costs, materials costs (steel for wind, steel and silicon for solar), and income tax rates—all of which fall outside of the control of the wind and solar industries, and make it harder to determine the influence of learning.
Figure 2 shows the learning curves and learning rates derived from the normalized LCOE history in Figure 1 (shown as dots in Figure 2). Wind’s full-period learning rate of 15% means that for each doubling of cumulative installed wind capacity worldwide, wind’s LCOE has declined by 15%. Solar’s full-period learning rate is higher, at 24%. The team’s regression model identified two significant learning change points for wind (around 2006 and 2010), and one for solar (around 2014), with both technologies exhibiting a period of accelerated learning of 40%–45% through 2020. But it is possible that wind’s accelerated learning rate from 2010–2020 is at least partly a correction to the period of rising LCOE witnessed from 2006–2010.
“These segmented regression results nevertheless suggest that learning need not slow as industries mature,” Wiser said.
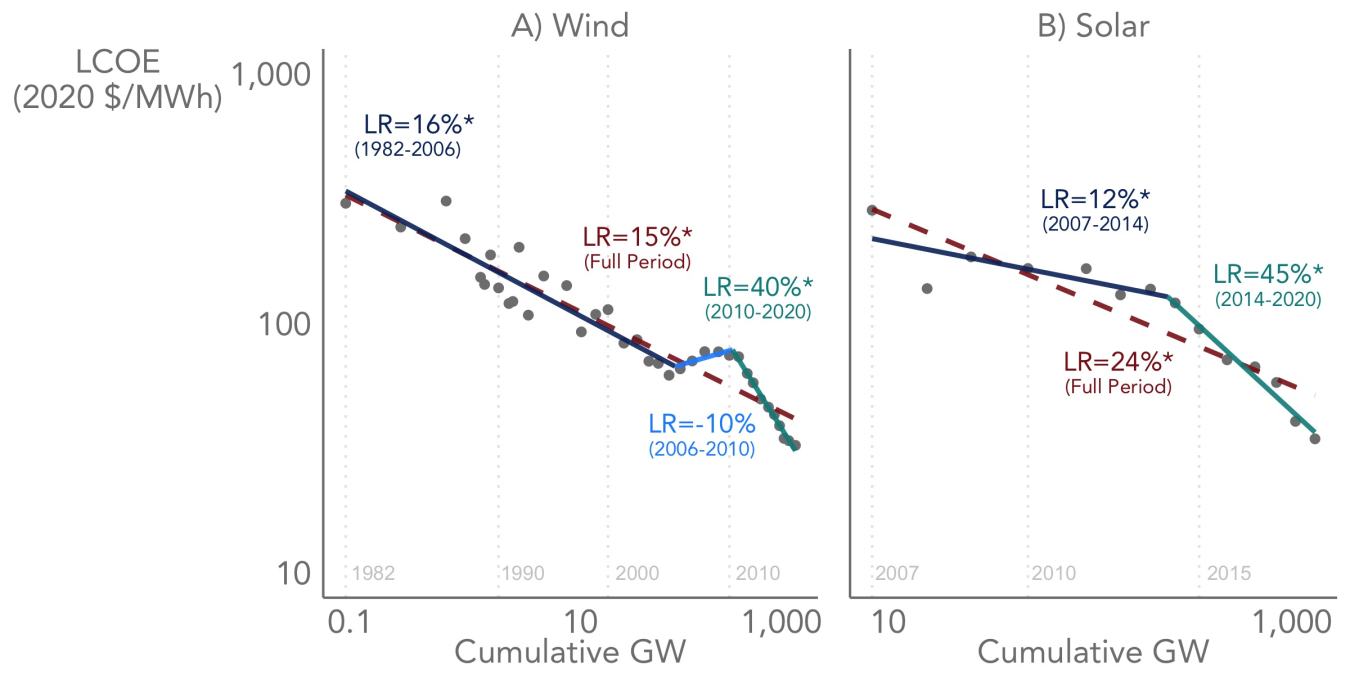
Figure 2. LCOE-based learning curves for utility-scale wind and solar exhibit significant change points that separate periods of faster and slower learning. An asterisk indicates statistical significance (p<0.05); LR is the learning rate; and GW is gigawatts.
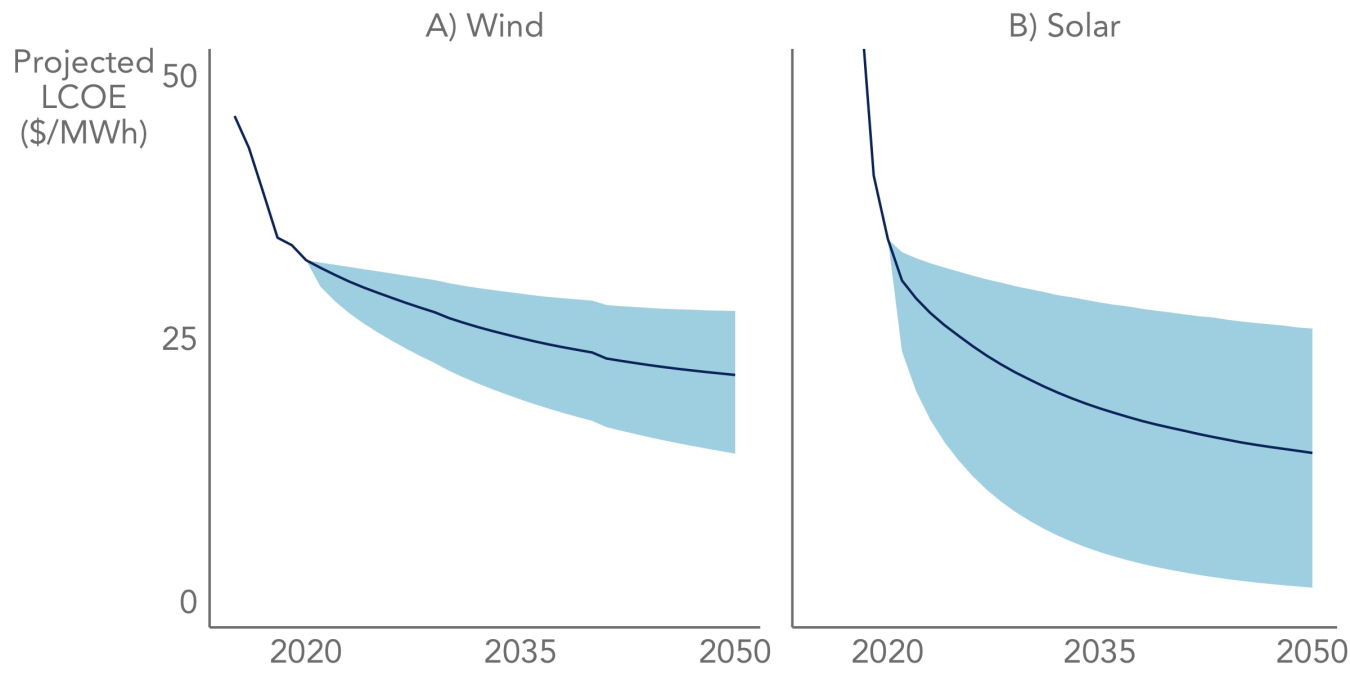
Figure 3 uses the full-period learning rates from Figure 2 (along with average deployment projections) to project LCOE into the future.
“We used the full-period learning rates to project LCOE because of uncertainty over how long the recent period of accelerated learning might persist,” O’Shaughnessy said. “We have already seen supply chain challenges and commodity price inflation pressuring wind and solar costs in 2021 and 2022.
Though the LCOE normalization process would likely remove some of the recent inflationary pressure, it is also possible that the model might identify 2021 or 2022 as the next change point, signaling a shift back to slower learning.
With its higher full-period learning rate of 24%, coupled with greater deployment projections, solar’s LCOE is expected to drop below wind’s LCOE within the next few years, though there is greater uncertainty surrounding solar’s LCOE projection given its shorter history.
Whatever the ultimate rate of decline ends up being, with positive learning rates and deployment of both technologies widely expected to continue, learning curves suggest that we can look forward to progressively lower-cost wind and solar energy in the coming years—which is good news for the transition to clean energy in the near future.
The study was funded by the U.S. Department of Energy’s Wind Energy Technologies Office, Solar Energy Technologies Office, and Office of Strategic Analysis.
Subscribe to the WETO e-newsletter to stay informed on the latest wind energy news, events, publications, and updates.


