What’s hot this spring? Hydropower—and the recently released third edition of the U.S. Hydropower Market Report lays out a compelling case for it.
Water Power Technologies Office
March 25, 2021What’s hot this spring? Hydropower—and the recently released third edition of the U.S. Hydropower Market Report lays out a compelling case for it.
U.S. Hydropower Market Report

Join us for our Hydropower Market Report webinar on March 31 to learn more about hydropower and PSH and how they can contribute to the resiliency and sustainability of U.S. energy systems.
Since the publication of the 2017 edition of the report, hydropower capacity has grown by 431 megawatts (MW), or roughly enough energy to power more than 350,000 average American homes. And in 2019, 38% of all electricity generated from renewable sources came from hydropower.
Produced by the U.S. Department of Energy (DOE) Water Power Technologies Office (WPTO), the report combines data from both public and commercial sources, as well as DOE research and development projects, to provide a comprehensive view of the U.S. hydropower and pumped-storage hydropower (PSH) fleet and industry trends.
Rendering key data publicly available and easily accessible, the report fills a consequential knowledge gap for this important sector of the renewable energy industry.
Top Five Takeaways
Taking a deep dive into hydropower developments from 2017 to 2019, the report also grounds this information within the context of the high-level trends of the past 10 to 20 years.
This new edition also provides updates on the U.S. and global hydropower and PSH development pipeline, hydropower prices, and performance metrics published in the 2017 edition.
Of the many insightful data points featured in this report, five significant statistics stood out from the rest:
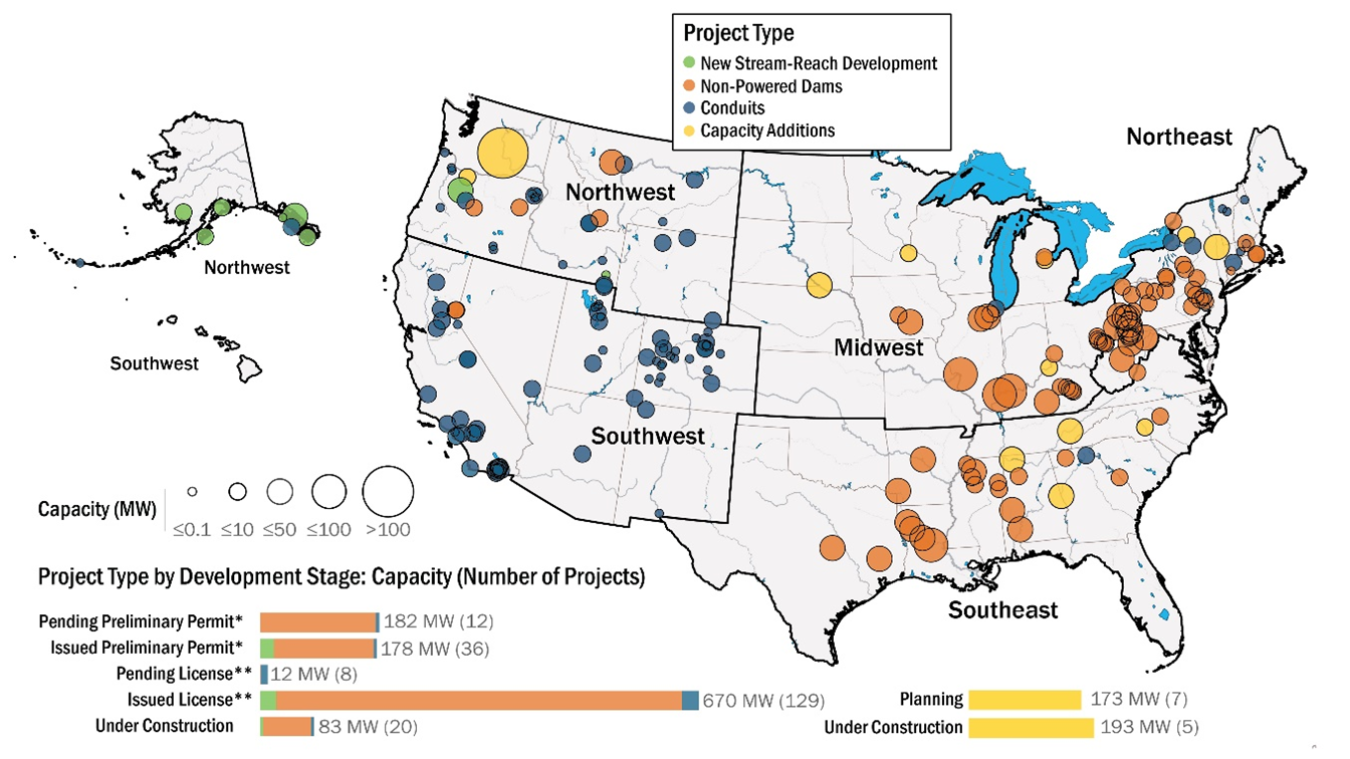
1. Nearly 1.5 gigawatts (GW) of hydropower are in the U.S. development pipeline.
At the end of 2019, 217 hydropower projects, with a total proposed capacity of 1.49 GW slated for development.
Sixty percent of those projects—with a combined capacity of 670 MW—had received federal authorization; however, construction had not yet been initiated.
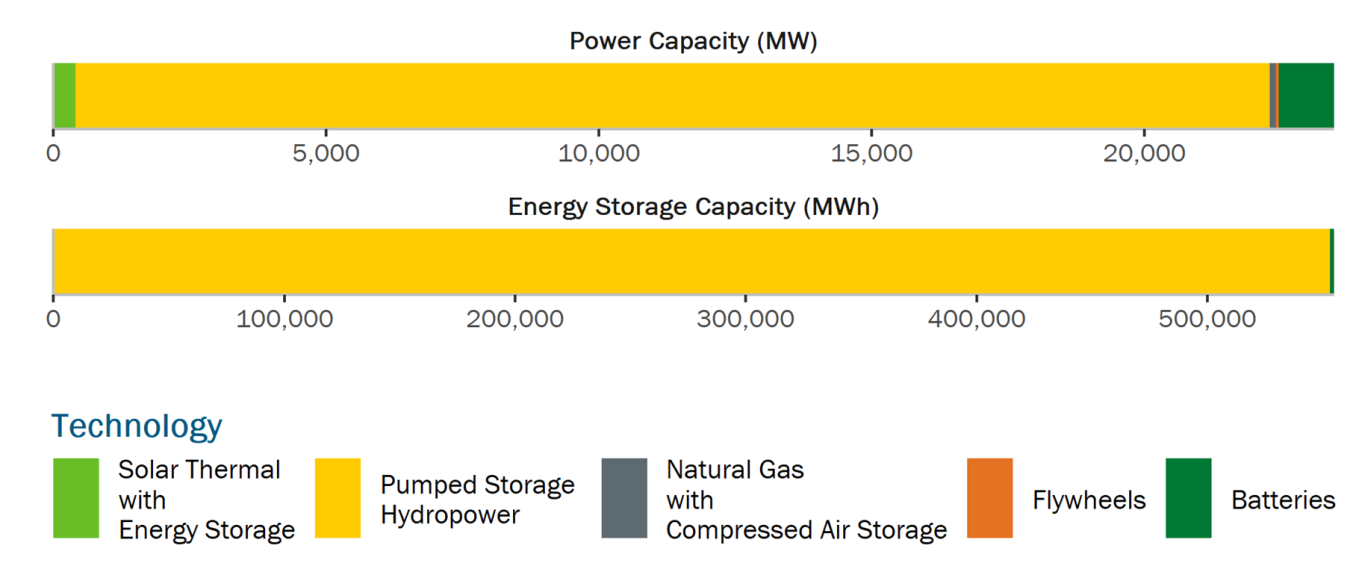
2. As of the end of 2019, PSH accounted for 93% of utility-scale storage power capacity in the United States.
PSH added significant capacity in the past decade.
From 2010 to 2019, net PSH capacity increased by 1,333 MW. Except for the Olivenhain-Hodges facility in California (42 MW), the remaining increase came from upgrades to six existing PSH plants:
- Castaic in California
- Northfield Mountain in Massachusetts
- Muddy Run in Pennsylvania
- Bad Creek in South Carolina
- Fairfield in South Carolina
- Jocassee in South Carolina.
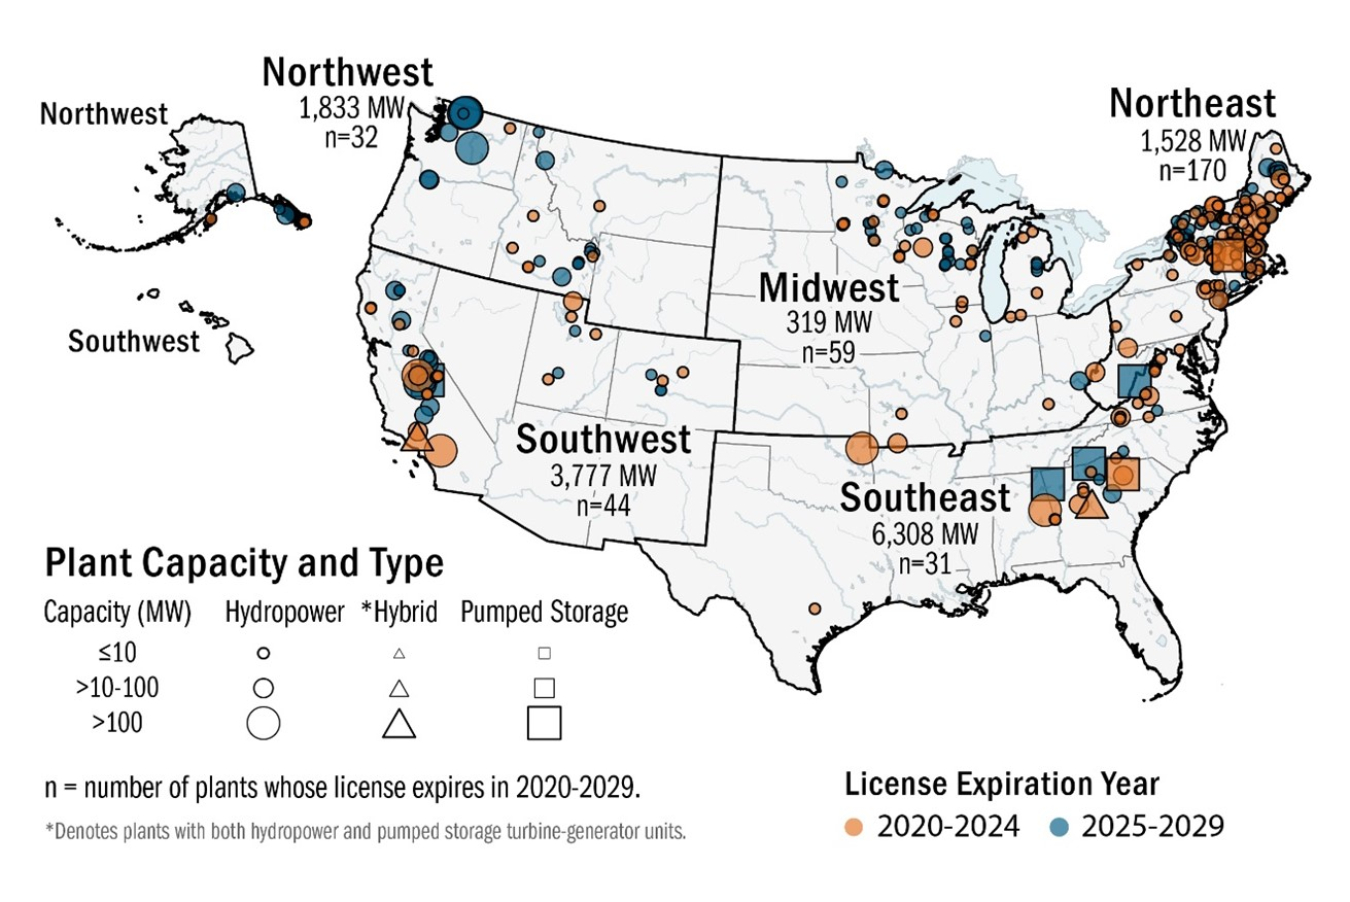
3. Federal Energy Regulatory Commission (FERC) relicensing activity is expected to more than double in the 2020s, relative to the 2010s.
In the decade spanning the 2020s, 281 licenses currently authorizing 12% (4.7 GW) of installed FERC-licensed hydropower capacity and 50% (9.1 GW) of FERC-licensed PSH are set to expire. The owners of these projects need to obtain a new license from FERC to continue operation after the expiration date of their current licenses.
Complying with the terms and conditions of a new license often requires some investment. Relicensing may also necessitate changes in operations that affect the operational flexibility of these projects.
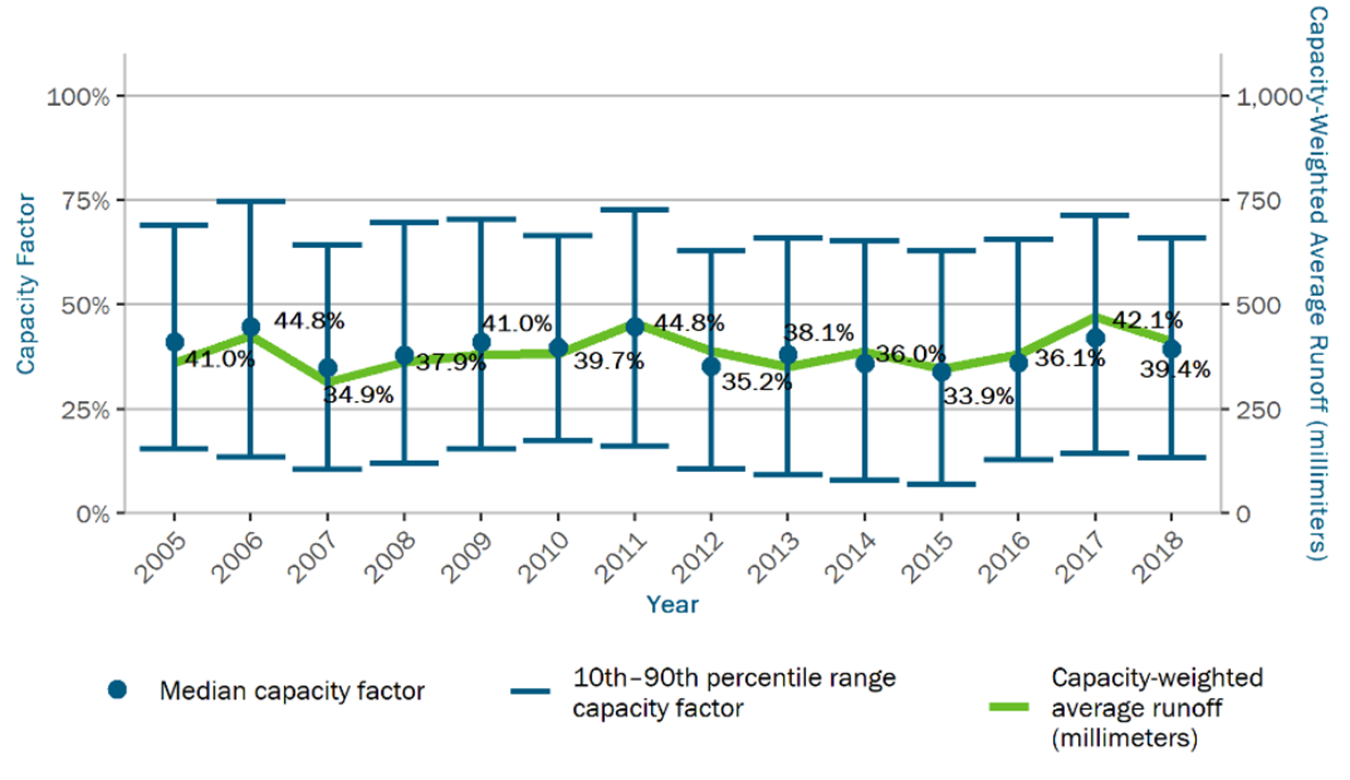
4. Median U.S. hydropower capacity factor from 2005 to 2018 ranged between 35% and 45%, largely depending on hydrological conditions.
Capacity factor measures how often a plant is running at maximum power. For example, a plant with a capacity factor of 100% means it is producing at its maximum power rating all the time.
On average, the median capacity factor for U.S. hydropower was found to be 39% during this period of time.
Hydrological and market conditions, as well as plant-level variables, such as mode of operation, outage schedule, and multipurpose constraints explain variability across plants and years.
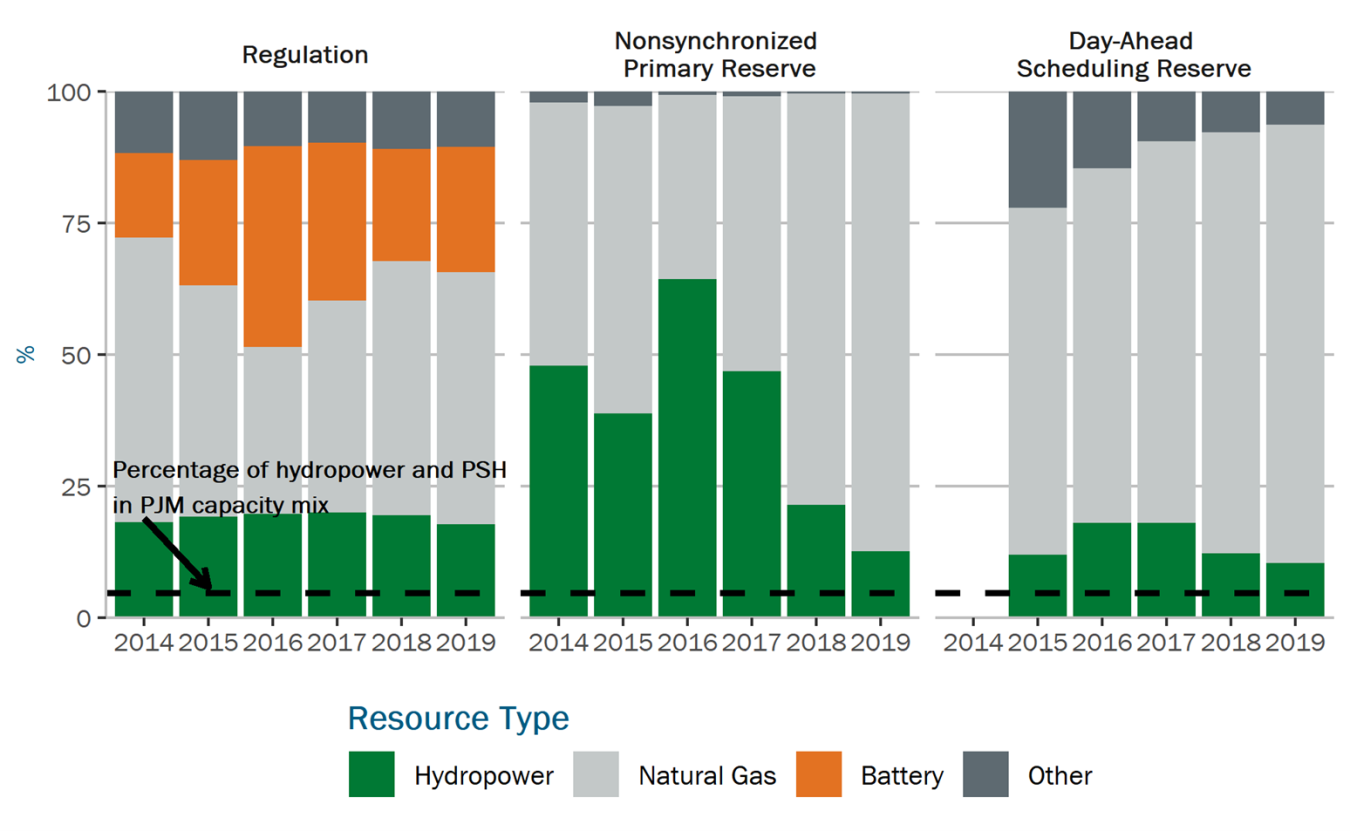
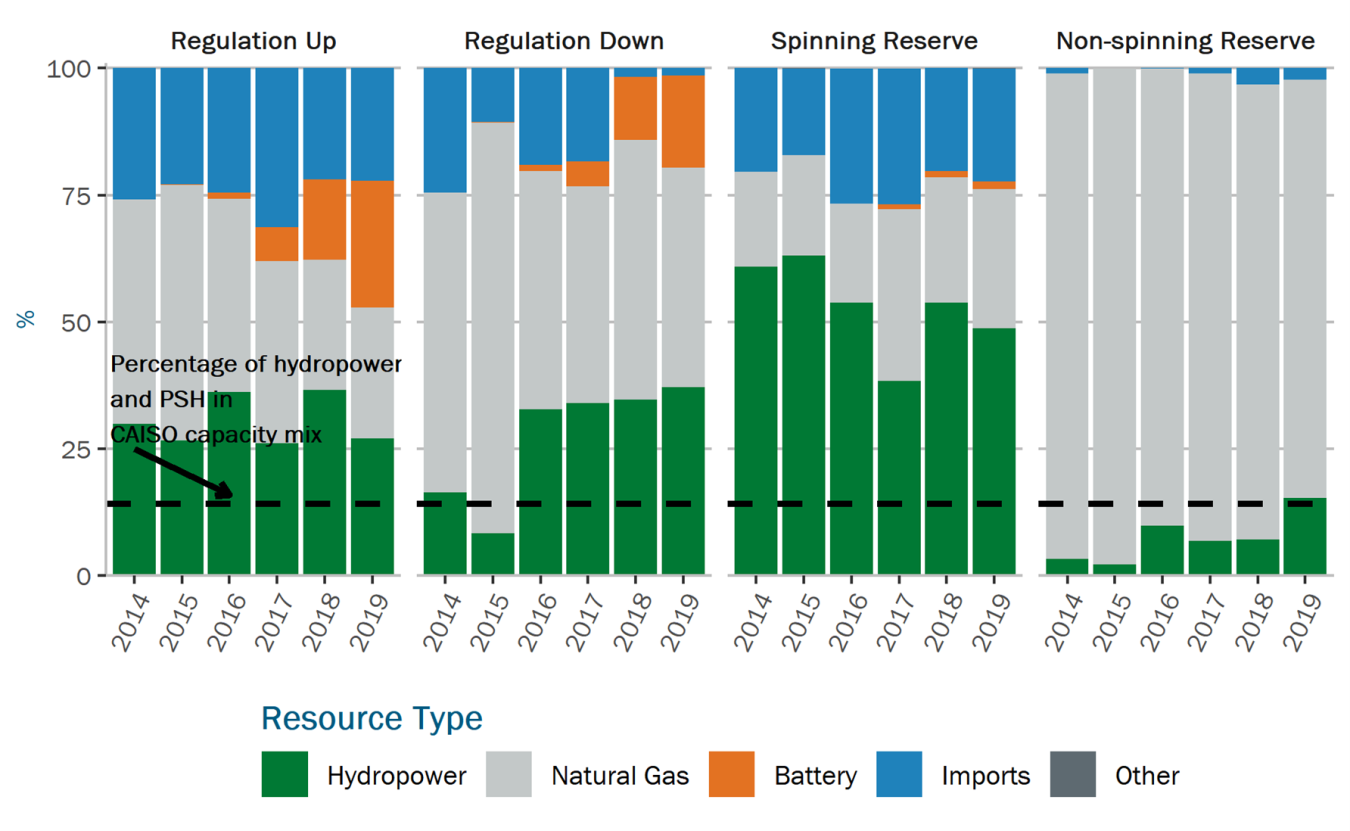
5. In multiple independent system operator (ISO) regions, the shares of frequency regulation and reserves provided by hydropower are much higher than hydropower’s share of installed capacity.
ISOs and regional transmission organizations (RTOs) manage grid operations within certain territories and operate markets to procure energy and ancillary services.
The report found that hydropower “punches above its weight” regarding provision of ancillary services—such as black start, frequency regulation, and reserves—to the grid.