
SUBSCRIBE to the Fact of the Week
Until recently, the petroleum imported into the United States (net imports) followed a similar trend to the petroleum consumed. However, from 2013 to 2015 the consumption of petroleum rose each year while petroleum imports declined. Net imports of petroleum were about 4.7 million barrels per day (mmbd) in 2015 which was more than 60% lower than the peak in 2005. The last year in which net imports were lower than 5 mmbd was 1985. The 2015 share of net imports to petroleum consumption also declined to the lowest point since 1971.
U.S. Petroleum Consumption, Net Imports, and Share of Net Imports to Petroleum Consumption, 1950-2015
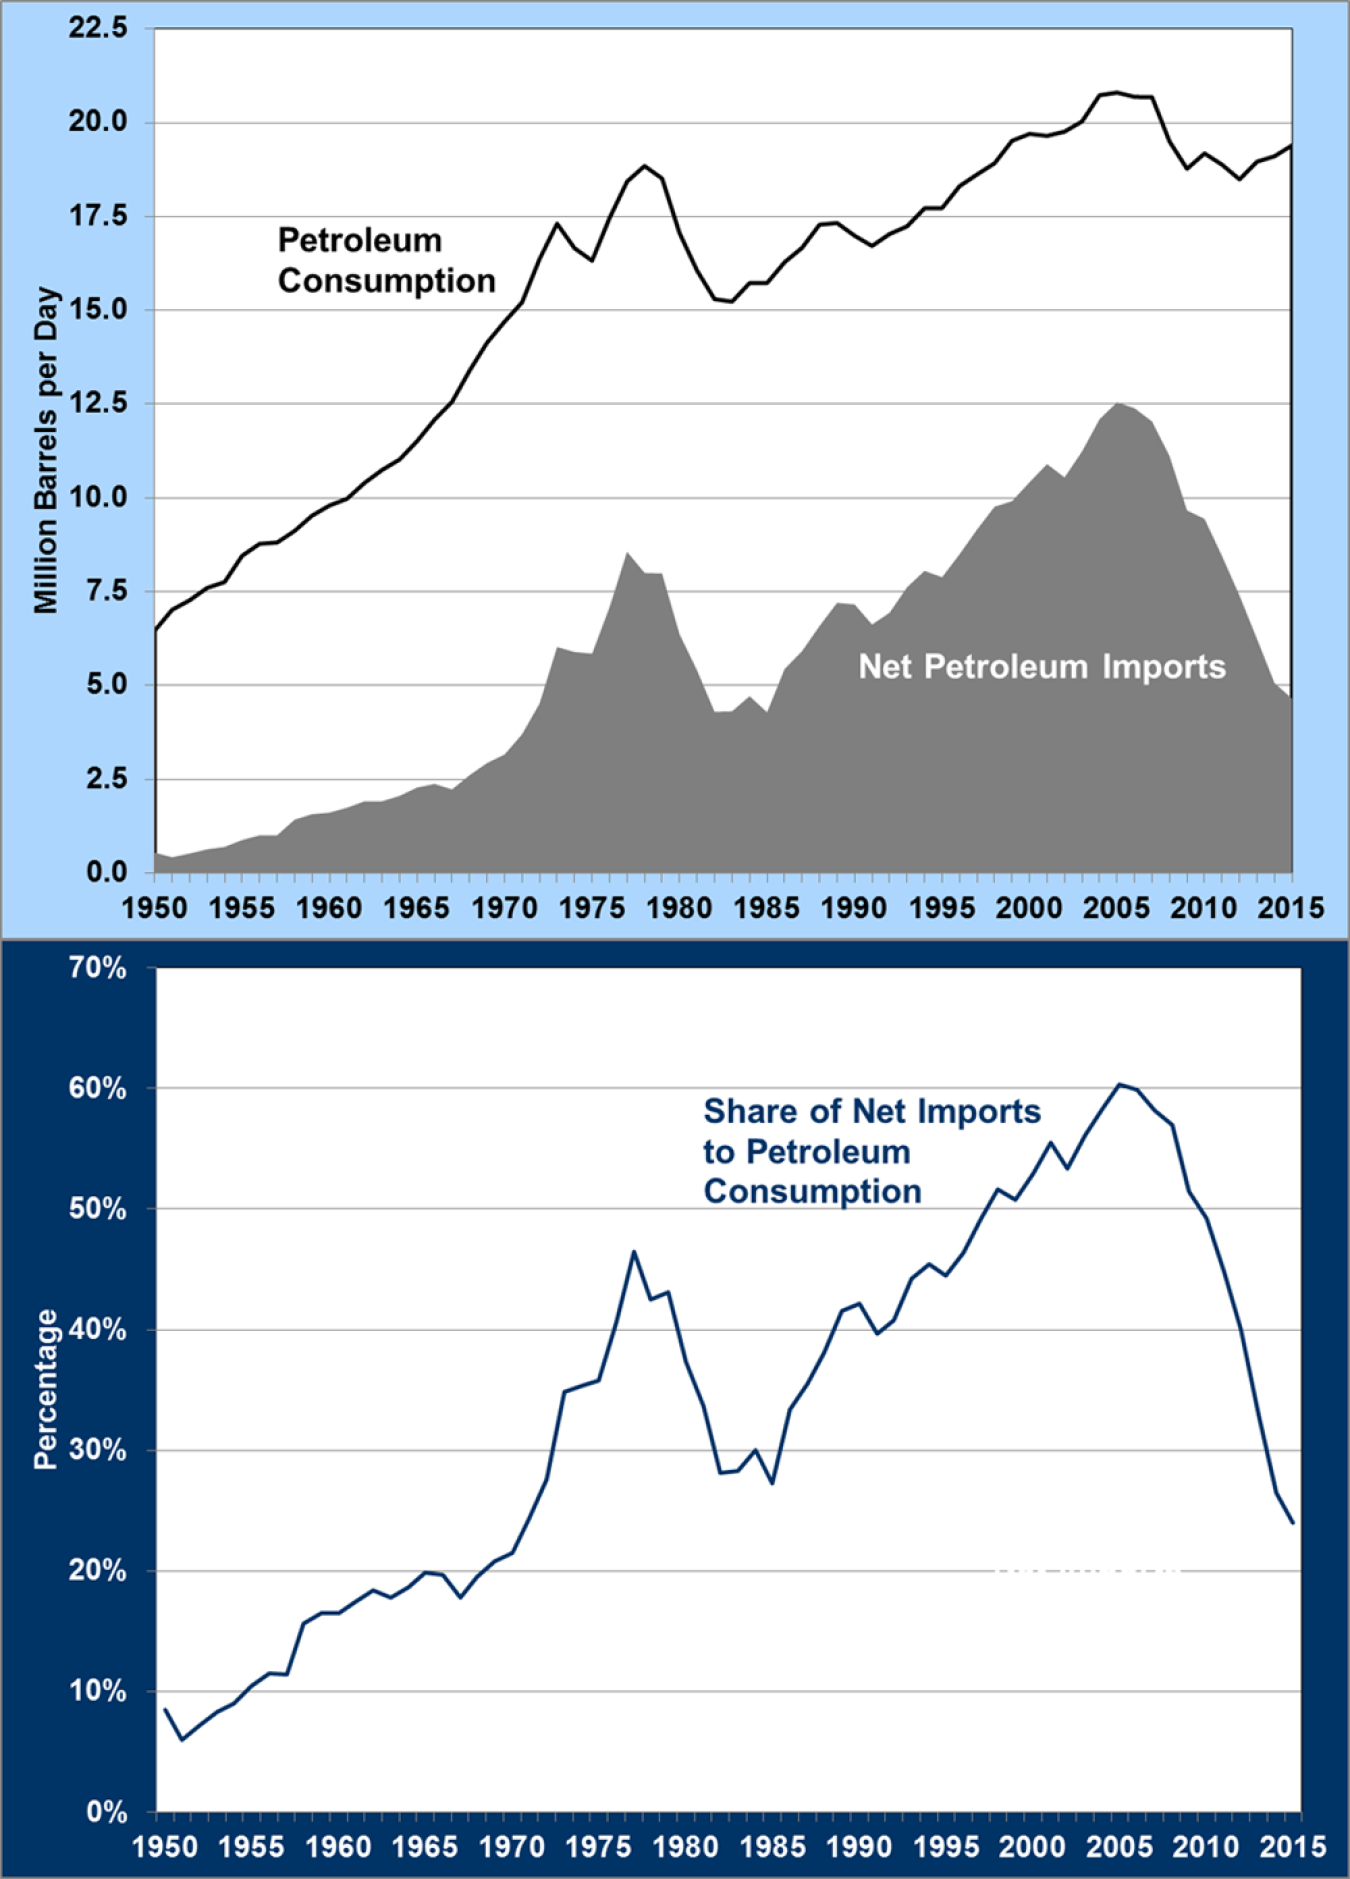
Note: Net imports are total imports minus exports.
Supporting Information
| Year | Net Imports of Petroleum (mmbd) | Petroleum Consumption (mmbd) | Share of Net Imports to Petroleum Consumption |
|---|---|---|---|
| 1950 | 0.55 | 6.46 | 8% |
| 1951 | 0.42 | 7.02 | 6% |
| 1952 | 0.52 | 7.27 | 7% |
| 1953 | 0.63 | 7.60 | 8% |
| 1954 | 0.70 | 7.76 | 9% |
| 1955 | 0.88 | 8.46 | 10% |
| 1956 | 1.01 | 8.78 | 11% |
| 1957 | 1.01 | 8.81 | 11% |
| 1958 | 1.42 | 9.12 | 16% |
| 1959 | 1.57 | 9.53 | 16% |
| 1960 | 1.61 | 9.80 | 16% |
| 1961 | 1.74 | 9.98 | 17% |
| 1962 | 1.91 | 10.40 | 18% |
| 1963 | 1.91 | 10.74 | 18% |
| 1964 | 2.06 | 11.02 | 19% |
| 1965 | 2.28 | 11.51 | 20% |
| 1966 | 2.37 | 12.08 | 20% |
| 1967 | 2.23 | 12.56 | 18% |
| 1968 | 2.61 | 13.39 | 19% |
| 1969 | 2.93 | 14.14 | 21% |
| 1970 | 3.16 | 14.70 | 22% |
| 1971 | 3.70 | 15.21 | 24% |
| 1972 | 4.52 | 16.37 | 28% |
| 1973 | 6.02 | 17.31 | 35% |
| 1974 | 5.89 | 16.65 | 35% |
| 1975 | 5.85 | 16.32 | 36% |
| 1976 | 7.09 | 17.46 | 41% |
| 1977 | 8.56 | 18.43 | 46% |
| 1978 | 8.00 | 18.85 | 42% |
| 1979 | 7.99 | 18.51 | 43% |
| 1980 | 6.36 | 17.06 | 37% |
| 1981 | 5.40 | 16.06 | 34% |
| 1982 | 4.30 | 15.30 | 28% |
| 1983 | 4.31 | 15.23 | 28% |
| 1984 | 4.72 | 15.73 | 30% |
| 1985 | 4.29 | 15.73 | 27% |
| 1986 | 5.44 | 16.28 | 33% |
| 1987 | 5.91 | 16.67 | 35% |
| 1988 | 6.59 | 17.28 | 38% |
| 1989 | 7.20 | 17.33 | 42% |
| 1990 | 7.16 | 16.99 | 42% |
| 1991 | 6.63 | 16.71 | 40% |
| 1992 | 6.94 | 17.03 | 41% |
| 1993 | 7.62 | 17.24 | 44% |
| 1994 | 8.05 | 17.72 | 45% |
| 1995 | 7.89 | 17.72 | 44% |
| 1996 | 8.50 | 18.31 | 46% |
| 1997 | 9.16 | 18.62 | 49% |
| 1998 | 9.76 | 18.92 | 52% |
| 1999 | 9.91 | 19.52 | 51% |
| 2000 | 10.42 | 19.70 | 53% |
| 2001 | 10.90 | 19.65 | 55% |
| 2002 | 10.55 | 19.76 | 53% |
| 2003 | 11.24 | 20.03 | 56% |
| 2004 | 12.10 | 20.73 | 58% |
| 2005 | 12.55 | 20.80 | 60% |
| 2006 | 12.39 | 20.69 | 60% |
| 2007 | 12.04 | 20.68 | 58% |
| 2008 | 11.11 | 19.50 | 57% |
| 2009 | 9.67 | 18.77 | 51% |
| 2010 | 9.44 | 19.18 | 49% |
| 2011 | 8.45 | 18.88 | 45% |
| 2012 | 7.39 | 18.49 | 40% |
| 2013 | 6.24 | 18.96 | 33% |
| 2014 | 5.07 | 19.11 | 27% |
| 2015 | 4.65 | 19.40 | 24% |
Source: | |||