
SUBSCRIBE to the Fact of the Week
The nation's highway vehicle miles of travel (VMT) and the U.S. gross domestic product (GDP) reflect strikingly similar patterns, indicating the strong relationship between the nation's economy and its travel. Beginning in the late 1990's, GDP grew at a faster rate than VMT, uncoupling the two data series. With the growth of VMT in 2015, the gap between the two series has narrowed for the first time since the Great Recession.
GDP and VMT Trends, 1960-2015
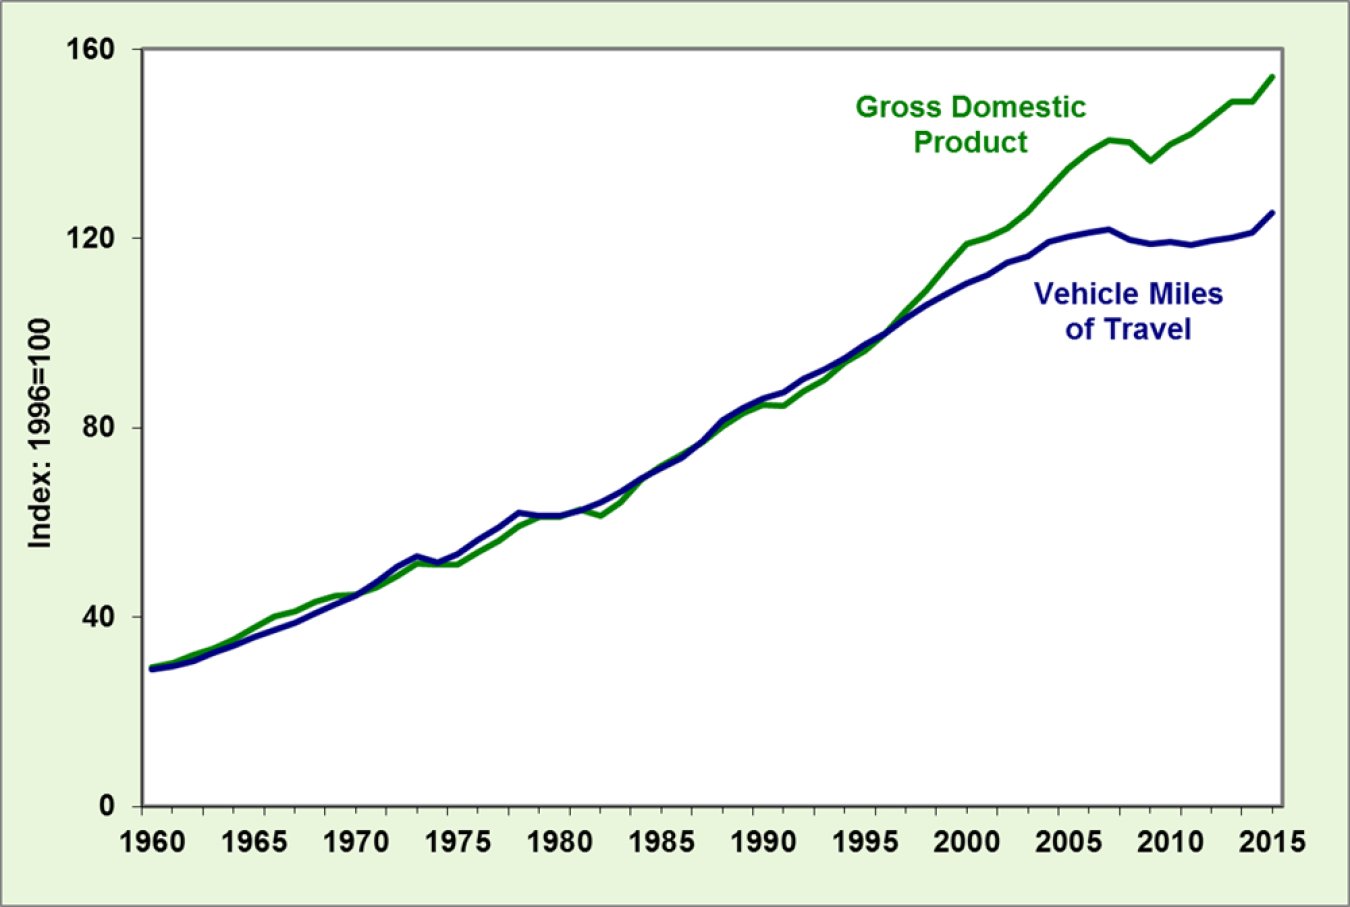
Note: Data for the last quarter of 2015 were not available and were estimated using 2014 data.
Supporting Information
| Year | GDP in Constant 2009 dollars (billions) | VMT (millions) | Indexed to 1996 | |
|---|---|---|---|---|
| GDP | VMT | |||
| 1960 | 3,108.7 | 718,762 | 29.4 | 28.9 |
| 1961 | 3,188.1 | 737,421 | 30.2 | 29.7 |
| 1962 | 3,383.1 | 766,734 | 32.0 | 30.8 |
| 1963 | 3,530.4 | 805,249 | 33.4 | 32.4 |
| 1964 | 3,734.0 | 846,298 | 35.4 | 34.0 |
| 1965 | 3,976.7 | 887,812 | 37.7 | 35.7 |
| 1966 | 4,238.9 | 925,899 | 40.1 | 37.2 |
| 1967 | 4,355.2 | 964,005 | 41.2 | 38.8 |
| 1968 | 4,569.0 | 1,015,869 | 43.3 | 40.9 |
| 1969 | 4,712.5 | 1,061,791 | 44.6 | 42.7 |
| 1970 | 4,722.0 | 1,109,724 | 44.7 | 44.6 |
| 1971 | 4,877.6 | 1,178,811 | 46.2 | 47.4 |
| 1972 | 5,134.3 | 1,259,786 | 48.6 | 50.7 |
| 1973 | 5,424.1 | 1,313,110 | 51.4 | 52.8 |
| 1974 | 5,396.0 | 1,280,544 | 51.1 | 51.5 |
| 1975 | 5,385.4 | 1,327,664 | 51.0 | 53.4 |
| 1976 | 5,675.4 | 1,402,380 | 53.7 | 56.4 |
| 1977 | 5,937.0 | 1,467,027 | 56.2 | 59.0 |
| 1978 | 6,267.2 | 1,544,704 | 59.3 | 62.1 |
| 1979 | 6,466.2 | 1,529,133 | 61.2 | 61.5 |
| 1980 | 6,450.4 | 1,527,295 | 61.1 | 61.4 |
| 1981 | 6,617.7 | 1,555,308 | 62.7 | 62.6 |
| 1982 | 6,491.3 | 1,595,010 | 61.5 | 64.2 |
| 1983 | 6,792.0 | 1,652,788 | 64.3 | 66.5 |
| 1984 | 7,285.0 | 1,720,269 | 69.0 | 69.2 |
| 1985 | 7,593.8 | 1,774,826 | 71.9 | 71.4 |
| 1986 | 7,860.5 | 1,834,872 | 74.4 | 73.8 |
| 1987 | 8,132.6 | 1,921,204 | 77.0 | 77.3 |
| 1988 | 8,474.5 | 2,025,962 | 80.2 | 81.5 |
| 1989 | 8,786.4 | 2,096,487 | 83.2 | 84.3 |
| 1990 | 8,955.0 | 2,144,362 | 84.8 | 86.3 |
| 1991 | 8,948.4 | 2,172,050 | 84.7 | 87.4 |
| 1992 | 9,266.6 | 2,247,151 | 87.7 | 90.4 |
| 1993 | 9,521.0 | 2,296,378 | 90.2 | 92.4 |
| 1994 | 9,905.4 | 2,357,588 | 93.8 | 94.8 |
| 1995 | 10,174.8 | 2,422,696 | 96.3 | 97.5 |
| 1996 | 10,561.0 | 2,485,848 | 100.0 | 100.0 |
| 1997 | 11,034.9 | 2,561,695 | 104.5 | 103.1 |
| 1998 | 11,525.9 | 2,631,522 | 109.1 | 105.9 |
| 1999 | 12,065.9 | 2,691,056 | 114.2 | 108.3 |
| 2000 | 12,559.7 | 2,746,925 | 118.9 | 110.5 |
| 2001 | 12,682.2 | 2,790,372 | 120.1 | 112.3 |
| 2002 | 12,908.8 | 2,855,508 | 122.2 | 114.9 |
| 2003 | 13,271.1 | 2,890,450 | 125.7 | 116.3 |
| 2004 | 13,773.5 | 2,964,788 | 130.4 | 119.3 |
| 2005 | 14,234.2 | 2,989,430 | 134.8 | 120.3 |
| 2006 | 14,613.8 | 3,014,371 | 138.4 | 121.3 |
| 2007 | 14,873.7 | 3,031,124 | 140.8 | 121.9 |
| 2008 | 14,830.4 | 2,976,528 | 140.4 | 119.7 |
| 2009 | 14,418.7 | 2,956,764 | 136.5 | 118.9 |
| 2010 | 14,783.8 | 2,967,266 | 140.0 | 119.4 |
| 2011 | 15,020.6 | 2,950,402 | 142.2 | 118.7 |
| 2012 | 15,354.6 | 2,969,433 | 145.4 | 119.5 |
| 2013 | 15,583.3 | 2,988,323 | 147.6 | 120.2 |
| 2014 | 15,961.7 | 3,015,620 | 151.1 | 121.3 |
| 2015* | 16,270.0 | 3,120,977 | 154.1 | 125.5 |
* Data for the last quarter of 2015 were not available and were estimated using 2014 data. | ||||