
In 2013, there were about 3.8 million light vehicles sold with prices ranging from $30-35,000, which was the category with the highest sales volume. In contrast to 2013, the highest sales volume in 2008 was in the $25-30,000 range. About 3 million more vehicles were sold overall in 2013 compared to 2008. There were more high-priced vehicles sold in 2013, particularly in the $40-45,000 price range.
Light Vehicle Sales by Price Range, Calendar Years 2008 and 2013
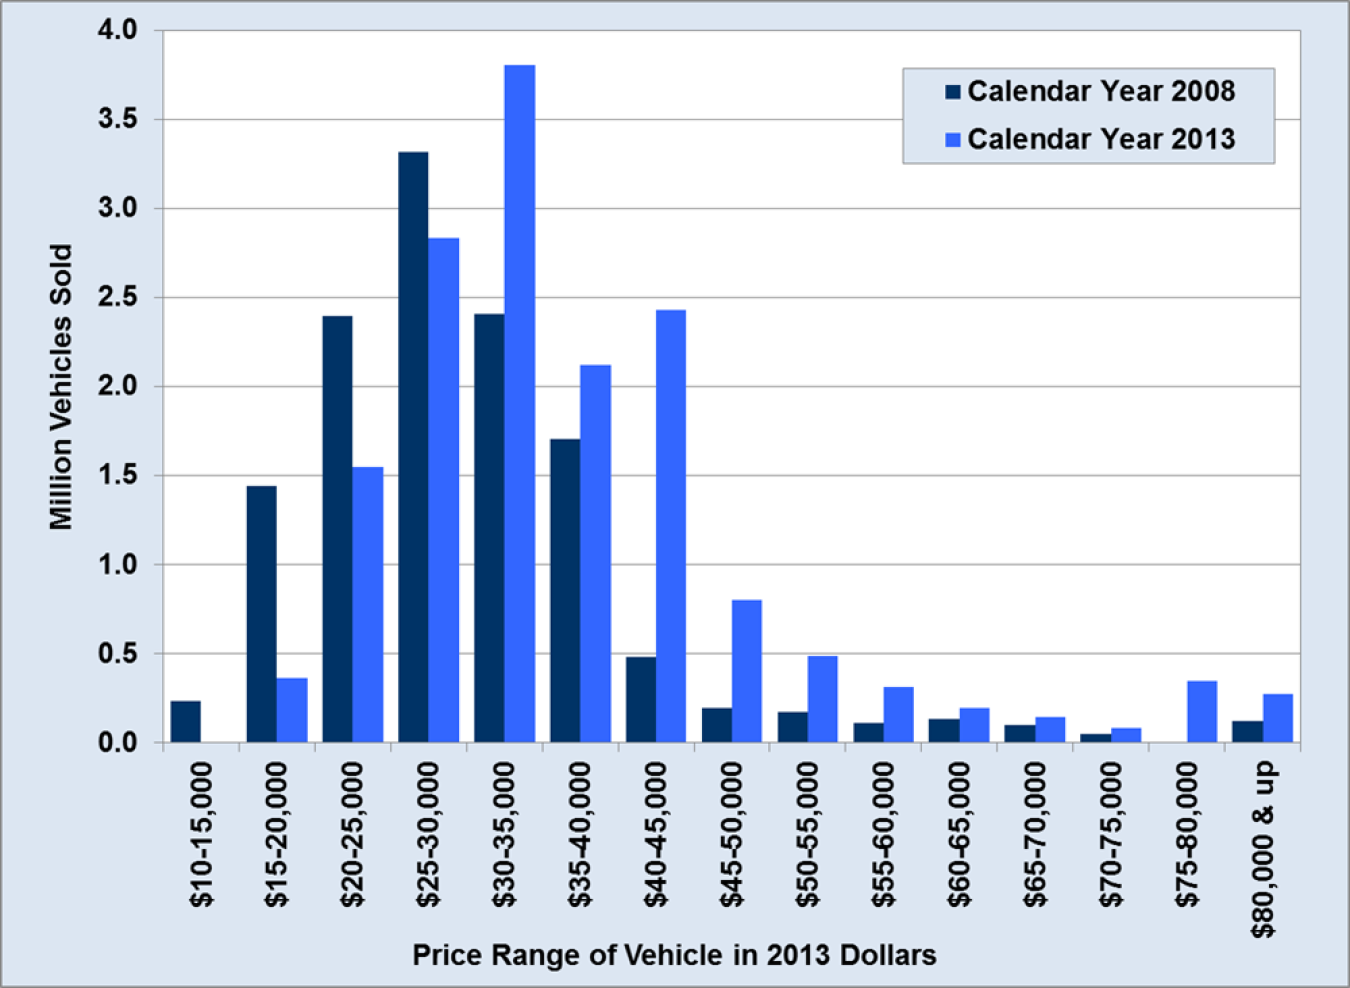
Note: Prices based on Manufacturers Suggested Retail Price (MSRP).
Supporting Information
| Price Range of Vehicle in 2013 Dollars | Calendar Year 2008 | Calendar Year 2013 |
|---|---|---|
| $10-15,000 | 237,272 | 0 |
| $15-20,000 | 1,440,082 | 361,213 |
| $20-25,000 | 2,392,629 | 1,549,078 |
| $25-30,000 | 3,314,387 | 2,835,153 |
| $30-35,000 | 2,405,499 | 3,803,957 |
| $35-40,000 | 1,703,401 | 2,120,369 |
| $40-45,000 | 480,756 | 2,428,428 |
| $45-50,000 | 192,922 | 804,159 |
| $50-55,000 | 175,623 | 486,179 |
| $55-60,000 | 109,474 | 310,866 |
| $60-65,000 | 132,277 | 193,538 |
| $65-70,000 | 98,754 | 144,400 |
| $70-75,000 | 50,544 | 80,503 |
| $75-80,000 | 0 | 347,659 |
| $80,000 & up | 123,867 | 275,937 |
| All | 12,857,487 | 15,741,439 |
Source: Oak Ridge National Laboratory, 2014 Vehicle Technologies Market Report, ORNL/TM-2015/85, March 2015. | ||