
Learn more about this year's most notable trends in the land-based wind market.
Wind Energy Technologies Office
August 12, 2019Each year, the U.S. Department of Energy assesses the state of the land-based wind market in the Wind Technologies Market Report. Listed below are some of the most notable trends from this year’s report.
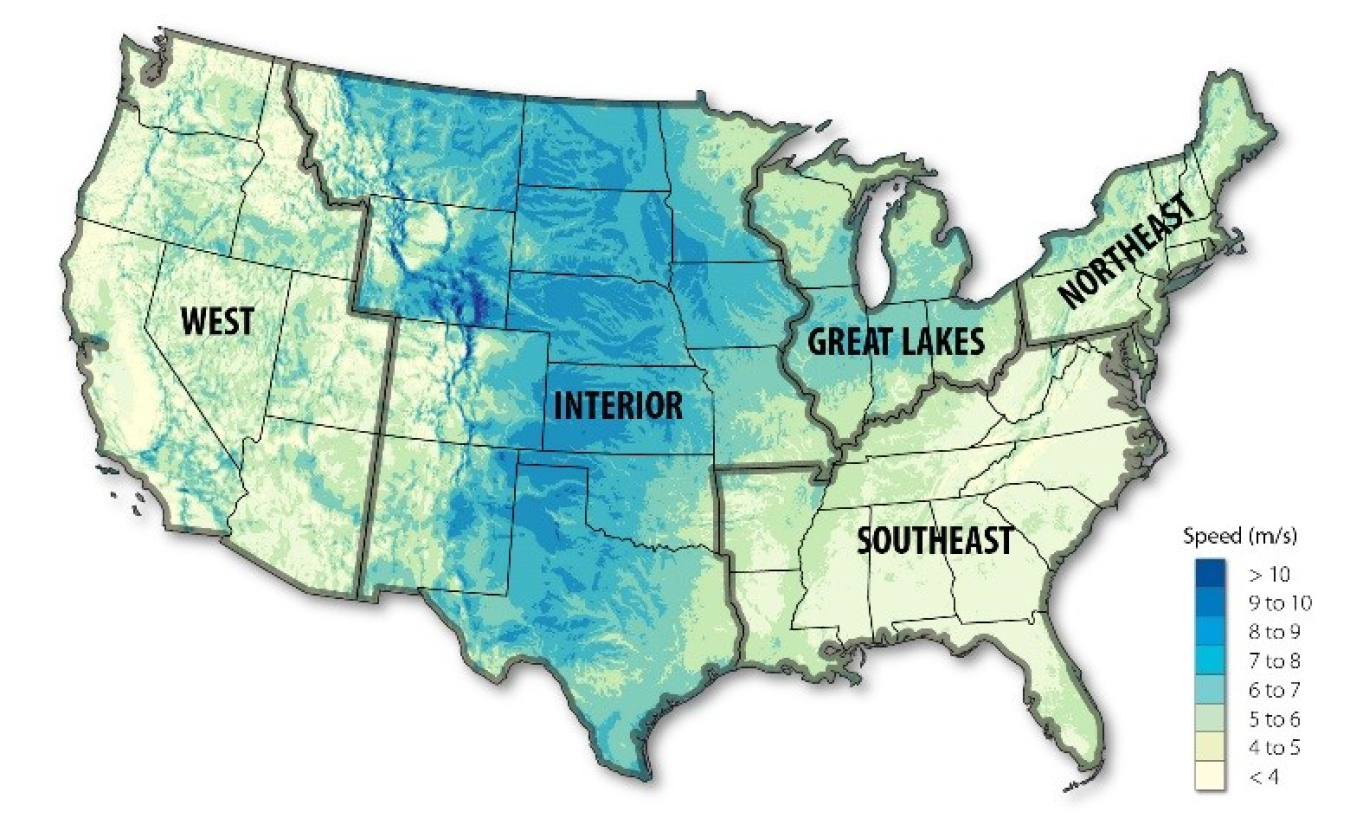
1. Regional
The Interior region of the United States—as shown in the map—continues to account for the majority of installed wind capacity as this is the region of the country with the highest wind speeds and therefore the highest production potential. The figure below highlights the annual wind capacity of different regions over time. As more states develop wind and renewable energy goals, other regions may increase their wind capacity. Overall, however, the nationwide cumulative capacity has seen a steady increase over the last 20 years.

Annual and cumulative growth in U.S. wind power installed capacity. | Figure 2 from the 2018 Wind Technologies Market Report.
2. Capacity
The nameplate capacity, or rated capacity, of a wind turbine is its maximum output rating, or how much power it can produce when operating at full capacity. The figure below illustrates the market’s move toward larger capacity turbines. The smallest turbines deployed in utility-scale wind plants in 2018 had a nameplate capacity of 1.5 megawatts (MW). The average nameplate capacity has also been steadily increasing, reaching 2.4 MW in 2018.
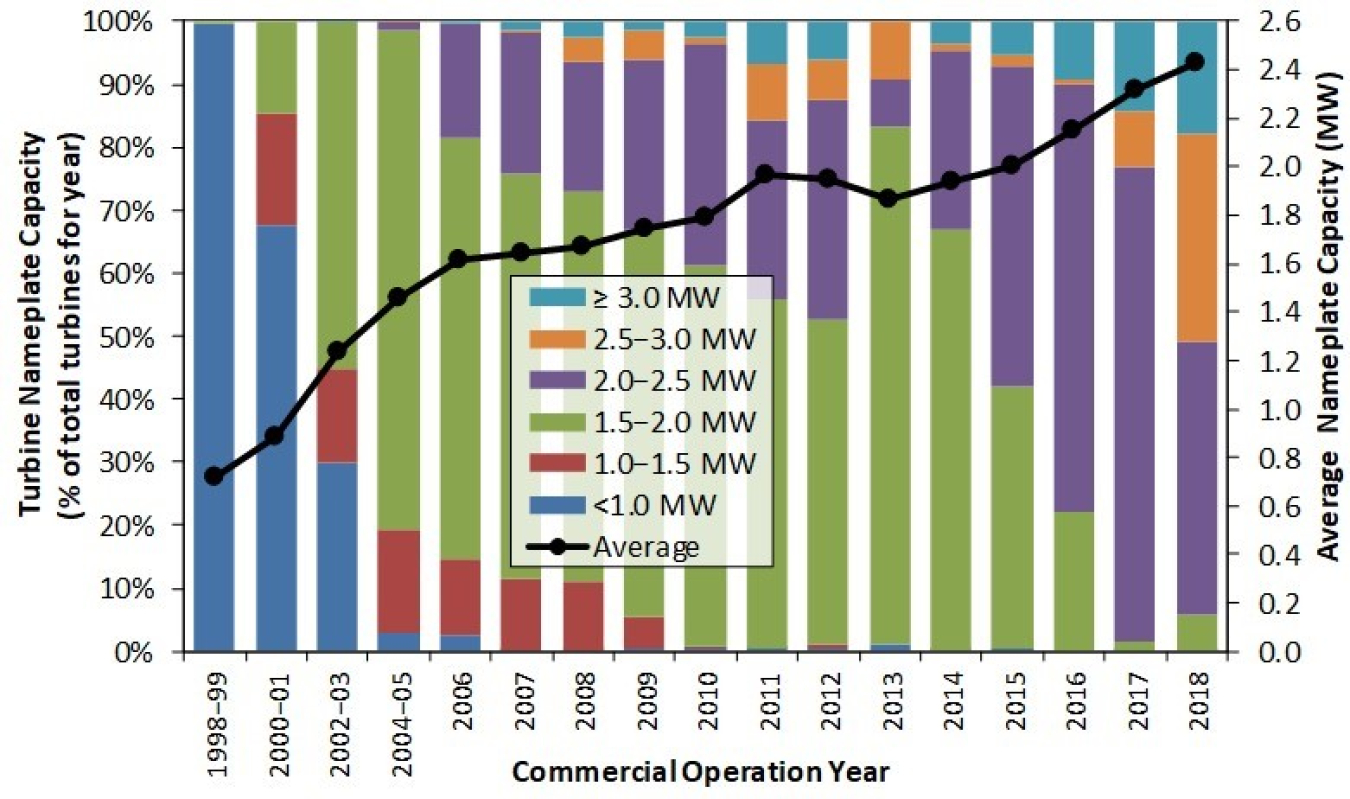
Trends in turbine nameplate capacity over time. | Figure 21 from the 2018 Wind Technologies Market Report.
3. Turbine Component Size
Increasing the size and capacity of a turbine will allow for greater output. The figure below plots average wind turbine nameplate capacity, rotor diameter (the diameter of the blades and hub), and hub (or tower) height over the last 20 years. Growth in these three areas highlight the technological advancement in land-based wind turbines.

Average turbine nameplate capacity, rotor diameter, and hub height for land-based wind projects over time. | Figure 20 from the 2018 Wind Technologies Market Report.
4. Decreasing Specific Power
The specific power of a turbine is the ratio of its nameplate-capacity rating to its rotor-swept area. In layman’s terms, when engineers are designing a turbine in a specific location, they will adjust the relationship between the diameter of the blades and the ability of the turbine engine to best capture the varying wind speeds. As discussed earlier, the available wind resources vary in different geographic locations. An efficient and long-lasting turbine will be able to both capture low wind speeds and stay intact during more drastic conditions, such as a hurricane. The below figure shows an increasing percentage of deployed turbines with lower specific power ratings and a decreasing average specific power. All else equal, a decrease in specific power will boost capacity factors—which measure how often a turbine is operating at full capacity— because the turbine can produce energy at a wider range of wind speeds.
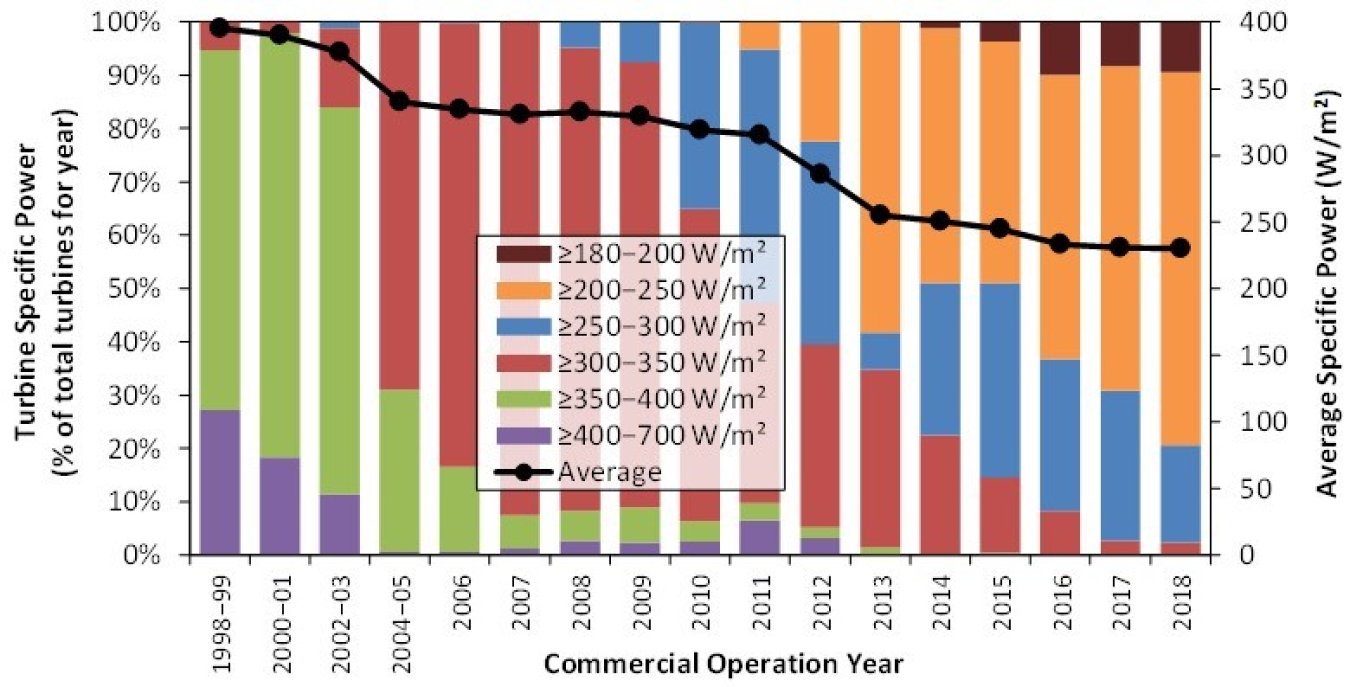
Trends in wind turbine specific power over time. | Figure 24 from the 2018 Wind Technologies Market Report.
Learn more about the U.S. land-based wind market in the U.S. Department of Energy’s 2018 Wind Technologies Market Report.