
Wind energy has joined the energy mainstream, thanks in large part to the wind integration studies funded by the Wind Energy Technologies Office.
Wind Energy Technologies Office
August 10, 2023In the 1980s, the electric power community considered wind energy a mere curiosity. Over the next 40 years, the U.S. Department of Energy’s (DOE) Wind Energy Technologies Office (WETO) worked to establish the electric sector's acceptance of wind energy, enabling it to become a significant contributor to the nation’s energy portfolio.
WETO, as well as others in the federal government and the private sector, have worked to provide opportunities for personnel at utilities to learn about wind, helping to transform it from a minor contributor to the grid to 10% of U.S. energy generation today.
In 1989, WETO partnered with the Electric Power Research Institute and several U.S. electric utilities to form the Utility Wind Interest Group (UWIG). At the time, wind was considered an unconventional, weather-driven, variable power source. However, over the next decade, UWIG offered utilities a forum to share their information about and experiences with wind power and learn from experts at the forefront of wind energy integration in the electric power industry and the national labs.
By the early 2000s, UWIG had become a go-to resource to identify, quantify, and address technical issues that arose when wind power was integrated into the traditional electric power grid. UWIG also provided an effective avenue for utility industry members to provide feedback to WETO—which provided UWIG with continuous financial and technical support.
Early Utility Concerns Shift from Wind Energy Costs to Operating Costs
In the early 2000s, utilities shifted their concerns from wind energy costs to wind power's variability and whether its corresponding uncertainty would increase system operating costs.
This concern led to one of the first grid integration studies, which UWIG conducted from 2001 through 2003. The study was funded by Xcel Energy with technical support from WETO and examined how Xcel Energy's electric system would respond with a significant amount of wind energy contributing to its electricity-generating mix. Engineers from DOE's National Renewable Energy Laboratory (NREL) and Oak Ridge National Laboratory (ORNL) helped define the study’s methodology and contributed expert technical review.
The study estimated that the financial impact of installed wind energy generation on system operating costs was less than $2 per megawatt-hour of wind energy—well under 10% of the wholesale value of that energy.
These results surprised many in the electric utility industry and helped pave the way for subsequent wind energy expansion in many utility systems. The results encouraged utilities and state governments in Minnesota, Colorado, Nevada, Arizona, Nebraska, Texas, California, and other states to evaluate the feasibility of higher contributions of wind power in their own systems—which included higher levels of wind energy than the UWIG study and increasingly larger geographic areas.
Regional Analyses Show Systems Can Handle High Wind Energy Penetration
Results from these early studies concluded that as larger geographical areas were deemed viable for wind energy, the system-operational costs arising from wind energy’s variability decreased—in part due to the naturally occurring geographic diversity of wind. At any particular moment, different locations in a region experience different winds, leading to some averaging of wind variations over the region. As a result, the variability of energy output decreases as wind power plants cover a larger geographic area. For example, a single wind turbine's output changes in response to local wind variations, but the many turbines in a 100-megawatt (MW) plant each experience different winds at any given moment. This leads to total plant output that is far smoother than that from any individual turbine. Furthermore, several 100 MW plants spread throughout a region will each see different winds, leading to additional averaging and even smoother combined output.
An additional factor contributed to reduced operating costs as the geographic area was expanded to include multiple electric utility service territories. Utility system operators needed to maintain balance between electricity demand and supply at all times, even as demand fluctuates and as unplanned equipment outages occur. Utilities reduce the costs of providing this balance by helping, and being helped by, neighboring utilities. Together, they all share the responsibility for maintaining overall balance throughout their combined, interconnected system. The system benefits—and costs are reduced—because the individual utilities don't all experience the same demand fluctuations or equipment emergencies at the same time, and because no individual utility needs to address imbalances completely by itself. This sharing feature also serves to reduce the impacts of wind variations and the associated costs.
This led to integration studies by independent system operators and regional transmission organizations that examined larger regions of the nation.
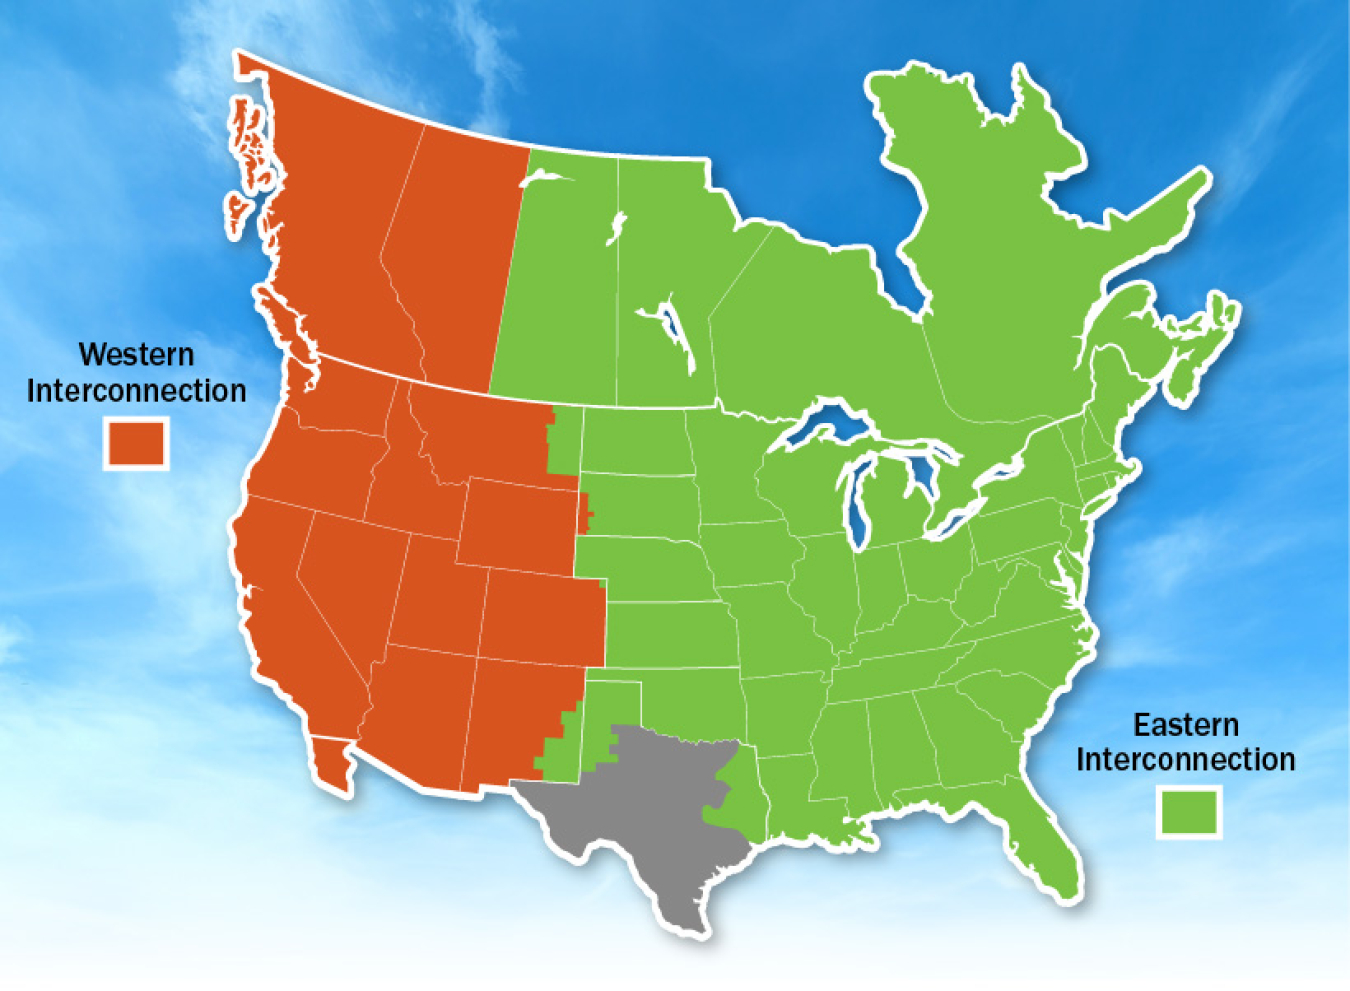
The Western and Eastern Interconnections in North America.
To ensure an organized approach across multiple entities, from 2008 through 2015, WETO funded NREL to define and manage large-area wind integration studies in the following U.S. areas:
- The Southwest
- The Western Interconnection (the Western Wind and Solar Integration Study)
- The Eastern Interconnection (the Eastern Wind Integration and Transmission Study and the Eastern Renewable Generation Integration Study).
The multistate Western and Eastern interconnection studies were conducted by experienced electric power planning and analysis experts and used tools and methodology well established in the electric power industry to simulate electric utility operations. To quantify the impacts of large amounts of wind energy and solar power on the grid, the studies examined system production costs (e.g., fuel and operations and maintenance), reliability, transmission congestion and wind curtailment, integration costs, and the response to major system events like regional wind ramps and deep cold events in the Northeast that affect natural gas availability.
These studies concluded that the electricity network could handle high contributions of wind power. In fact, because the designs of wind turbines deployed since the early 2000s included modern controls, such as the ability to provide active power control that can contribute to frequency regulation, their addition could enhance system reliability in some cases.
Wind Energy Becomes Mainstream
The involvement of utility-industry personnel and use of established power system methodologies and modeling tools for utility-industry analysis made these results highly credible for utilities.
Over the following years, UWIG expanded to address an ever-increasing scope of issues regarding utility integration and is now called the Energy Systems Integration Group (ESIG)—the nation’s leading forum for discussing the increasingly complex issues of power-system planning and operation with large shares of renewable energy. ESIG focuses on electric-sector technical support for renewable energy integration, DOE’s Grid Solutions program, and enabling technologies such as energy storage.
Additionally, as a follow-up to the regional interconnection studies, in 2020, NREL quantified the costs and benefits of strengthening the connection (or seam) between the Eastern and Western Interconnections, including new transmission, to encourage efficient development and utilization of U.S. energy resources.
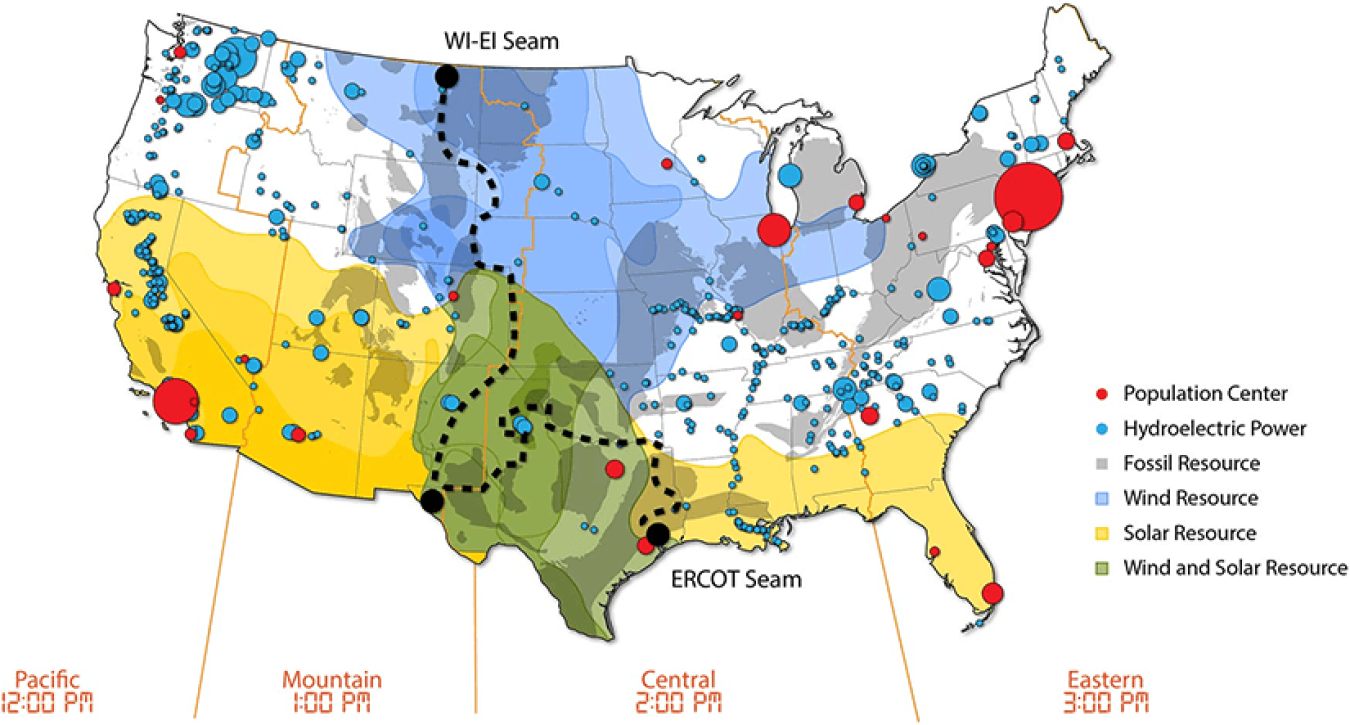
Connecting U.S. power systems, represented here conceptually, could enhance the ability to harness abundant renewable resources and balance energy loads across the country. WI = Western Interconnection; EI = Eastern Interconnection; ERCOT = Electric Reliability Council of Texas. Per the legend, red dots indicate the top 25 population centers; blue dots indicate hydroelectric facilities; gray shading shows areas with major fossil resource; blue shading shows areas with greatest wind resource; yellow shading shows areas with greatest solar resource; and green shading shows areas with wind and solar resource. The black dashed line divides the EI, WI, and ERCOT.
One of the follow-ups was the 2021 North American Renewable Integration report, a multiyear analysis on how expanding interregional and international transmission can support a reliable future power system. This analysis aimed to inform grid planners, utilities, industry, policymakers, and other stakeholders about challenges and opportunities for continental system integration of large amounts of wind, solar, and hydropower to support a low-carbon future grid.
Now, utilities recognize wind energy as one of the many energy sources contributing to their electric power systems. Wind has joined the energy mainstream, thanks in large part to WETO-funded wind energy integration studies.