
SUBSCRIBE to the Fact of the Week
Of the 2.3 million motor vehicles and component parts employees for the fourth quarter of 2016, 33% were in production/manufacturing jobs. Nearly another third (32%) were installation or repair positions. Administrative positions were the next largest category, with 13% of the employment. Management/professional positions, sales positions, and the "other" category each were less than 10% of the motor vehicles and component parts employment.
Occupational Distribution for Motor Vehicles and Component Parts, Quarter 4, 2016
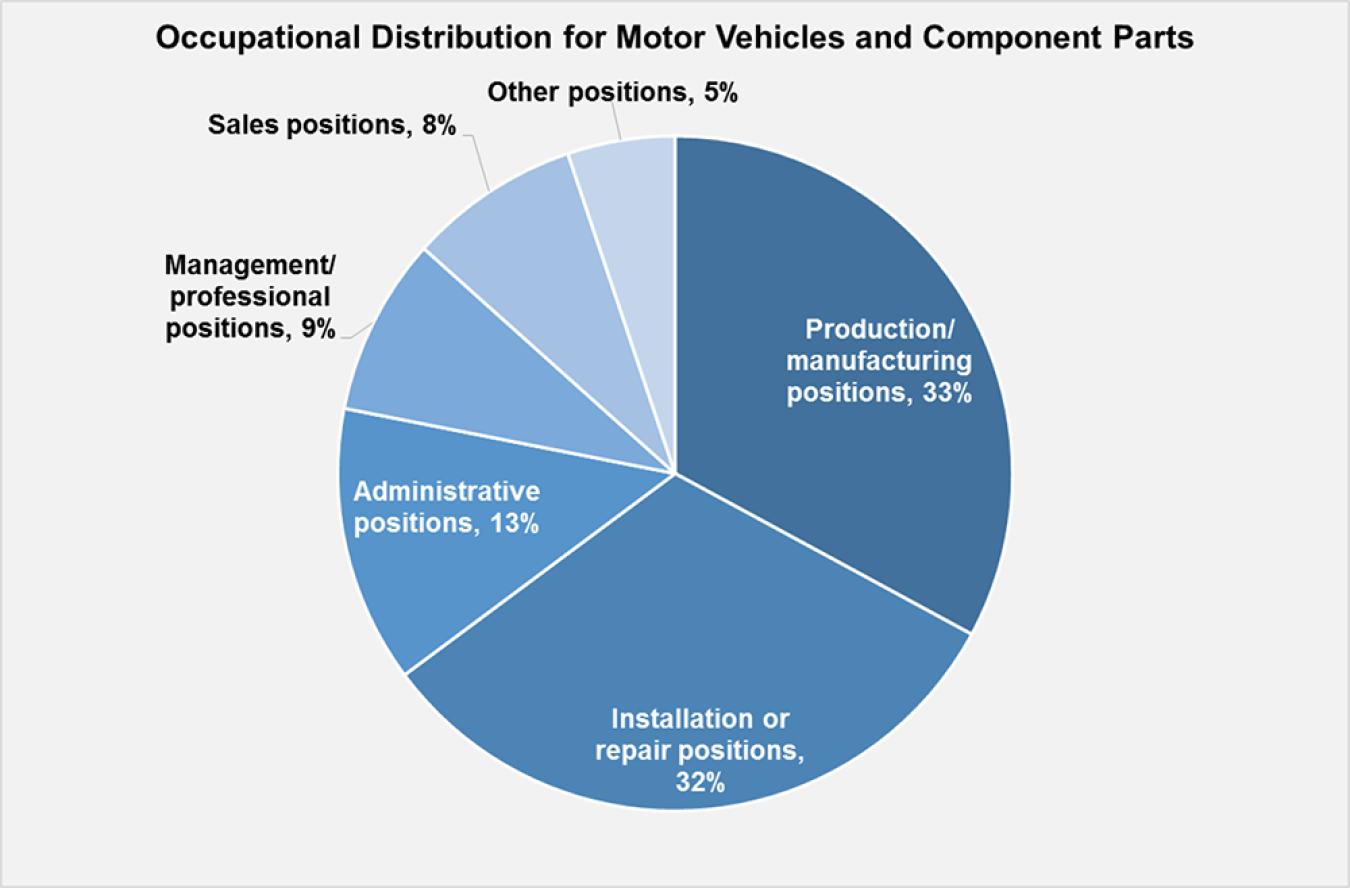
Note: Does not include employees that are involved in the transport of motor vehicles.
Supporting Information
| Occupation | Share of Employment |
|---|---|
| Production/manufacturing positions | 33% |
| Installation or repair positions | 32% |
| Administrative positions | 13% |
| Management/professional positions | 9% |
| Sales positions | 8% |
| Other positions | 5% |
| Total Employment | 2.3 million |
Source: U.S. Department of Energy, U.S. Energy and Employment Report, January 2017, Figure 48. | |