
SUBSCRIBE to the Fact of the Week
Motor gasoline is the most common petroleum product produced in U.S. refineries, followed by diesel fuel. In 1995, gasoline represented 47% of the products coming from refineries; in 2016, it was 50%. Diesel fuel experienced the largest increase in share from 1995 to 2016 – 20% to 24%. Other products, such as petroleum coke, asphalt, and lubricants, decreased from 21% to 15% of net output.
Share of U.S. Net Refinery Output, 1995-2016
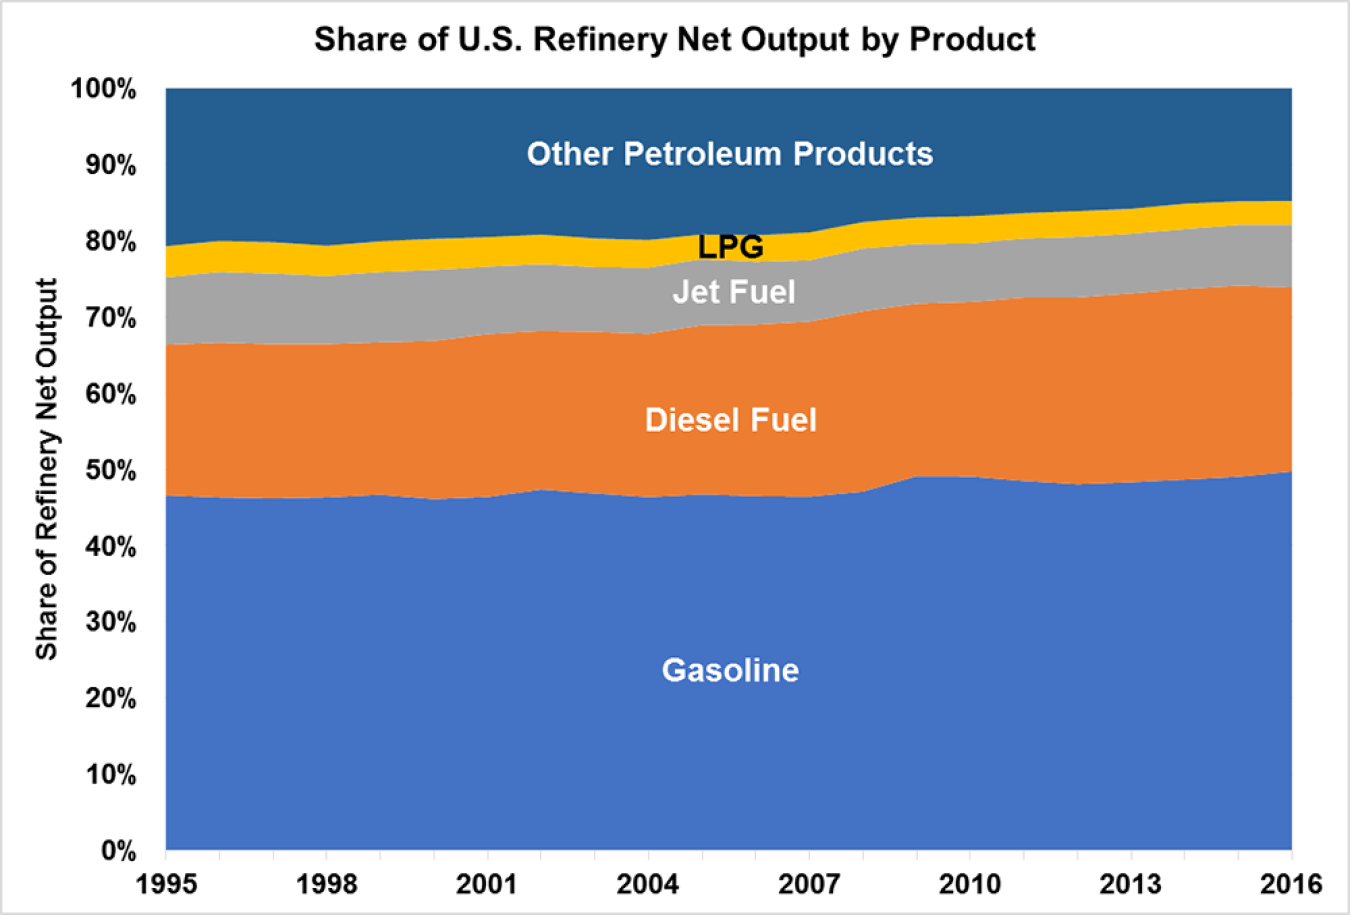
Note: "Other Petroleum Products" category includes petroleum coke, still gas, residual fuel oil, asphalt & road oil, naphtha, lubricants, petrochemical feedstock, kerosene, aviation gas, other oils and miscellaneous petroleum products.
Supporting Information
| Year | Gasoline | Diesel Fuel | Jet Fuel | LPG | Other Petroleum Products | Total |
|---|---|---|---|---|---|---|
| 1995 | 47% | 20% | 9% | 4% | 21% | 100% |
| 1996 | 46% | 20% | 9% | 4% | 20% | 100% |
| 1997 | 46% | 20% | 9% | 4% | 20% | 100% |
| 1998 | 46% | 20% | 9% | 4% | 21% | 100% |
| 1999 | 47% | 20% | 9% | 4% | 20% | 100% |
| 2000 | 46% | 21% | 9% | 4% | 20% | 100% |
| 2001 | 46% | 21% | 9% | 4% | 20% | 100% |
| 2002 | 47% | 21% | 9% | 4% | 19% | 100% |
| 2003 | 47% | 21% | 9% | 4% | 20% | 100% |
| 2004 | 46% | 21% | 9% | 4% | 20% | 100% |
| 2005 | 47% | 22% | 9% | 3% | 19% | 100% |
| 2006 | 47% | 22% | 8% | 3% | 19% | 100% |
| 2007 | 46% | 23% | 8% | 4% | 19% | 100% |
| 2008 | 47% | 24% | 8% | 3% | 18% | 100% |
| 2009 | 49% | 23% | 8% | 3% | 17% | 100% |
| 2010 | 49% | 23% | 8% | 4% | 17% | 100% |
| 2011 | 49% | 24% | 8% | 3% | 16% | 100% |
| 2012 | 48% | 25% | 8% | 3% | 16% | 100% |
| 2013 | 48% | 25% | 8% | 3% | 16% | 100% |
| 2014 | 49% | 25% | 8% | 3% | 15% | 100% |
| 2015 | 49% | 25% | 8% | 3% | 15% | 100% |
| 2016 | 50% | 24% | 8% | 3% | 15% | 100% |
| Source: Energy Information Administration, January 2017 Monthly Energy Review, Table 3.2. | ||||||