
SUBSCRIBE to the Fact of the Week
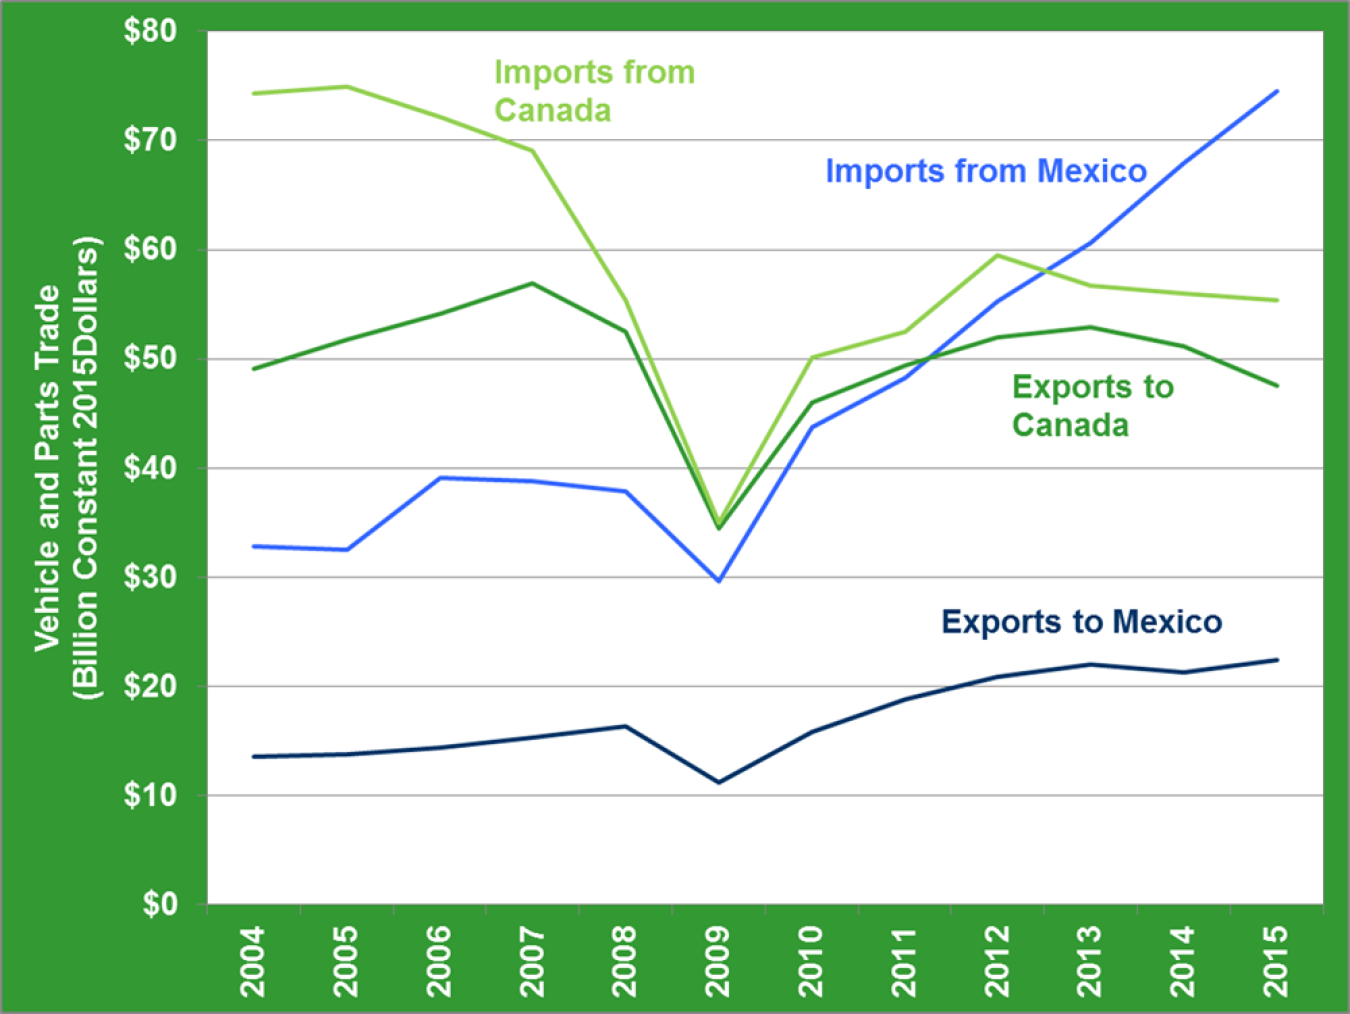
U.S. imports and exports of vehicles and parts dipped sharply during the Great Recession in 2009. Since that time, imports of vehicles and parts from Mexico to the United States have been steadily growing and by 2015 reached $74.5 billion. The value of vehicles/parts imports from Canada in 2004 was more than double imports from Mexico, but leveled off after 2012 to about $55 billion (constant 2015 dollars). Exports of vehicles/parts to Mexico rose above $20 billion for the first time in 2012.
Mexico and Canada Vehicles and Parts Trade Value, 2004-2015
Supporting Information
| Year | Export to Mexico | Import from Mexico | Export to Canada | Import from Canada |
|---|---|---|---|---|
| 2004 | $13.5 | $32.8 | $49.0 | $74.3 |
| 2005 | $13.7 | $32.5 | $51.8 | $74.9 |
| 2006 | $14.4 | $39.1 | $54.2 | $72.1 |
| 2007 | $15.3 | $38.8 | $56.9 | $69.0 |
| 2008 | $16.4 | $37.9 | $52.5 | $55.4 |
| 2009 | $11.2 | $29.6 | $34.5 | $34.9 |
| 2010 | $15.8 | $43.7 | $46.0 | $50.1 |
| 2011 | $18.9 | $48.3 | $49.4 | $52.5 |
| 2012 | $20.9 | $55.2 | $52.0 | $59.5 |
| 2013 | $22.0 | $60.6 | $52.9 | $56.7 |
| 2014 | $21.3 | $68.0 | $51.2 | $56.0 |
| 2015 | $22.4 | $74.5 | $47.6 | $55.4 |
Source: U.S. Department of Transportation, Bureau of Transportation Statistics, North American Transborder Freight Data: Trend Analysis. Commodity 87 = Vehicles, parts, and accessories. Monthly data were summed to annual totals. | ||||