
SUBSCRIBE to the Fact of the Week
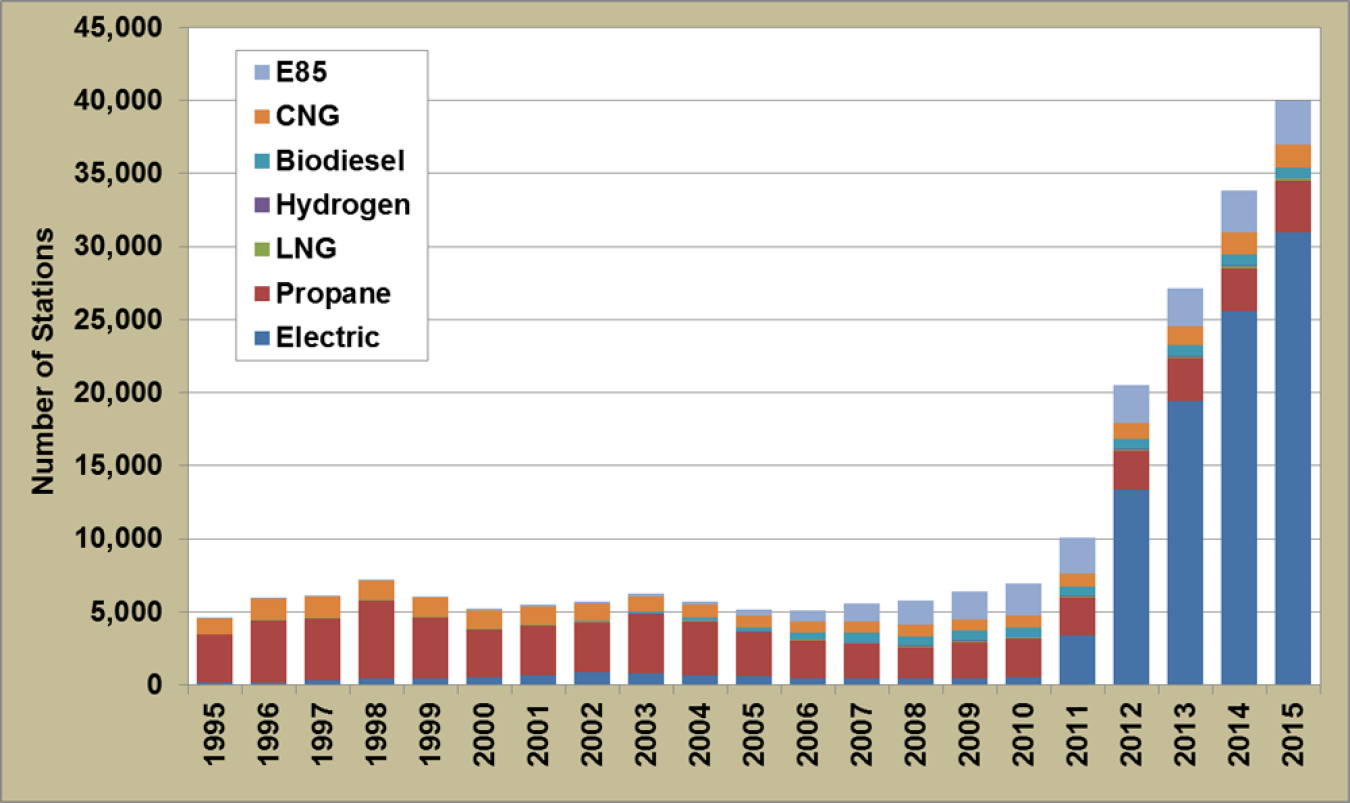
The number of electric charging stations grew from about 3,400 in 2011 to just over 30,000 in 2015. It should be noted that beginning in 2011, electric charging stations refers to individual plugs rather than a station which may have multiple plugs. Electric vehicle charge times are much longer than refueling times for other fuel types so the number of plugs is critical, but it can inflate the station count for electricity relative to the other alternative fuel types. In 2015, there were about 3,600 propane stations, 3,000 E85 stations, and 1,600 compressed natural gas (CNG) refueling stations. The other fuel types (biodiesel, liquefied natural gas (LNG) and hydrogen) altogether have less than 1,000 stations nationwide.
Alternative Fueling Stations by Fuel Type, 1995-2015
Supporting Information
| Year | Electric | Propane | LNG | Hydrogen | Biodiesel | CNG | E85 | Total |
|---|---|---|---|---|---|---|---|---|
| 1995 | 188 | 3,299 | n/a | n/a | n/a | 1,065 | 37 | 4,589 |
| 1996 | 194 | 4,252 | 72 | n/a | n/a | 1,419 | 68 | 6,005 |
| 1997 | 310 | 4,255 | 71 | n/a | n/a | 1,426 | 71 | 6,133 |
| 1998 | 486 | 5,318 | 66 | n/a | n/a | 1,268 | 40 | 7,178 |
| 1999 | 490 | 4,153 | 46 | n/a | n/a | 1,267 | 49 | 6,005 |
| 2000 | 558 | 3,268 | 44 | n/a | 2 | 1,217 | 113 | 5,202 |
| 2001 | 693 | 3,403 | 44 | n/a | 16 | 1,232 | 154 | 5,542 |
| 2002 | 873 | 3,431 | 36 | 7 | 79 | 1,166 | 149 | 5,741 |
| 2003 | 830 | 3,966 | 62 | 7 | 142 | 1,035 | 188 | 6,230 |
| 2004 | 671 | 3,689 | 58 | 9 | 176 | 917 | 200 | 5,720 |
| 2005 | 588 | 2,995 | 40 | 14 | 304 | 787 | 436 | 5,164 |
| 2006 | 465 | 2,619 | 37 | 17 | 459 | 732 | 762 | 5,091 |
| 2007 | 442 | 2,371 | 35 | 32 | 742 | 721 | 1,208 | 5,551 |
| 2008 | 430 | 2,175 | 38 | 46 | 645 | 778 | 1,644 | 5,756 |
| 2009 | 465 | 2,468 | 36 | 63 | 679 | 772 | 1,928 | 6,411 |
| 2010 | 541 | 2,647 | 39 | 58 | 644 | 841 | 2,142 | 6,912 |
| 2011 | 3,394 | 2,597 | 45 | 56 | 627 | 910 | 2,442 | 10,071 |
| 2012 | 13,392 | 2,654 | 59 | 58 | 675 | 1,107 | 2,553 | 20,498 |
| 2013 | 19,410 | 2,956 | 81 | 53 | 757 | 1,263 | 2,639 | 27,159 |
| 2014 | 25,602 | 2,931 | 103 | 51 | 783 | 1,495 | 2,840 | 33,805 |
| 2015 | 30,945 | 3,594 | 111 | 39 | 721 | 1,563 | 2,990 | 39,963 |
Notes: Stations selling low-level biodiesel blends (less than B20) are included in the station listing only for the years 2005-2007. Total is the total number of fuel types sold at stations. Stations are counted once for each type of fuel sold. Acronyms: Source: U.S. Department of Energy, Alternative Fuels Data Center, Alternative Fueling Station Counts by State, website accessed February 2016. | ||||||||