
SUBSCRIBE to the Fact of the Week
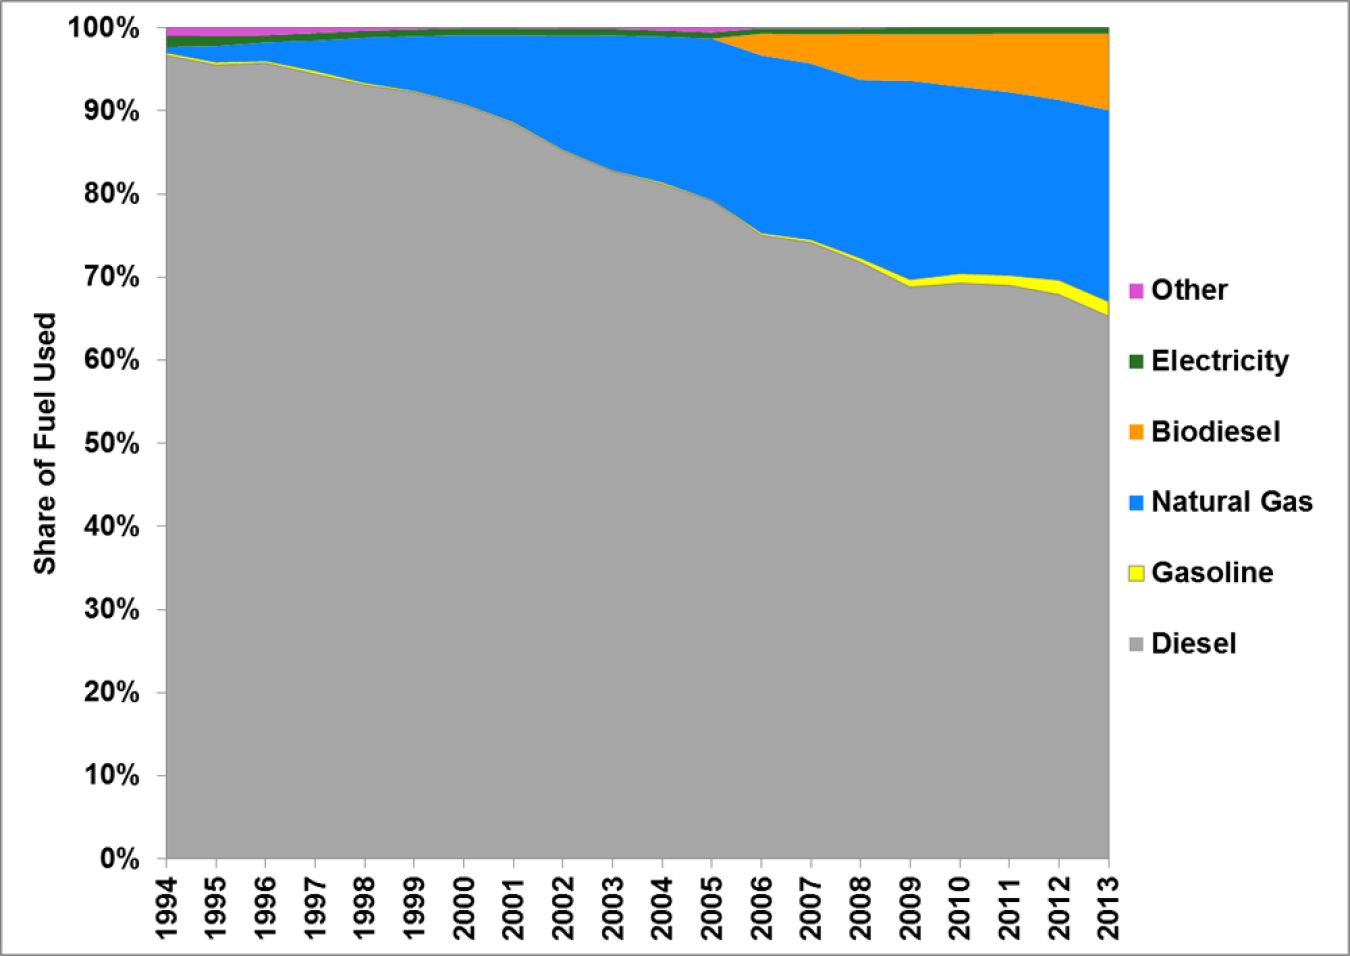
In 1994, 97% of fuel used in transit buses in the United States was petroleum-based diesel and gasoline, but by 2013 that number declined to 67%. The use of natural gas, including compressed natural gas, liquefied natural gas, and propane, increased substantially during this time period. Twenty-three percent of transit bus fuel use was natural gas in 2013. Beginning in the mid-2000’s biodiesel, a diesel fuel based on vegetable oil or animal fat was also used in transit buses. Biodiesel is typically blended with petroleum-based diesel to create a blend such as B5 or B20. By 2013 about 9% of transit bus fuel use was biodiesel.
Transit Bus Fuel Use Shares, 1994-2013
Notes:
- The biodiesel category includes an unknown amount of petroleum-based diesel, as each transit agency may use different blends of fuel and report it as biodiesel.
- Other fuels include bio/soy fuel, biodiesel (through 2006), hydrogen, methanol, ethanol, and various blends.
Supporting Information
| Calendar Year | Diesel | Gasoline | Natural Gas | Biodiesel | Electricity | Other | Total Fuel Use (Trillion Btu) |
| 1994 | 96.7% | 0.3% | 0.7% | 0.0% | 1.3% | 1.0% | 81.1 |
| 1995 | 95.5% | 0.4% | 1.9% | 0.0% | 1.3% | 0.9% | 81.9 |
| 1996 | 95.8% | 0.3% | 2.2% | 0.0% | 0.9% | 0.9% | 83.7 |
| 1997 | 94.4% | 0.4% | 3.6% | 0.0% | 0.9% | 0.6% | 87.8 |
| 1998 | 93.1% | 0.3% | 5.4% | 0.0% | 0.8% | 0.4% | 90.4 |
| 1999 | 92.2% | 0.2% | 6.5% | 0.0% | 0.8% | 0.2% | 92.9 |
| 2000 | 90.7% | 0.2% | 8.3% | 0.0% | 0.8% | 0.1% | 97.1 |
| 2001 | 88.5% | 0.2% | 10.5% | 0.0% | 0.8% | 0.1% | 92.1 |
| 2002 | 85.1% | 0.2% | 13.7% | 0.0% | 0.8% | 0.1% | 91.1 |
| 2003 | 82.7% | 0.2% | 16.2% | 0.0% | 0.8% | 0.1% | 90.3 |
| 2004 | 81.2% | 0.2% | 17.5% | 0.0% | 0.7% | 0.3% | 94.0 |
| 2005 | 79.2% | 0.1% | 19.4% | 0.0% | 0.7% | 0.6% | 93.5 |
| 2006 | 75.0% | 0.3% | 21.4% | 2.6% | 0.6% | 0.1% | 99.2 |
| 2007 | 74.2% | 0.3% | 21.2% | 3.5% | 0.7% | 0.1% | 92.4 |
| 2008 | 71.8% | 0.5% | 21.4% | 5.5% | 0.7% | 0.1% | 95.3 |
| 2009 | 68.8% | 0.9% | 23.9% | 5.6% | 0.8% | 0.0% | 91.8 |
| 2010 | 69.3% | 1.2% | 22.5% | 6.3% | 0.8% | 0.0% | 87.2 |
| 2011 | 69.0% | 1.2% | 22.0% | 7.1% | 0.7% | 0.0% | 91.5 |
| 2012 | 67.9% | 1.7% | 21.7% | 8.0% | 0.7% | 0.0% | 89.7 |
| 2013 | 65.3% | 1.8% | 23.0% | 9.2% | 0.7% | 0.0% | 90.8 |
Source: American Public Transportation Association, 2015 Public Transportation Fact Book, Washington, DC, 2015, Table 59. Original units (gallons and kilowatt-hours) were converted to Btu using the appropriate energy content. | |||||||