
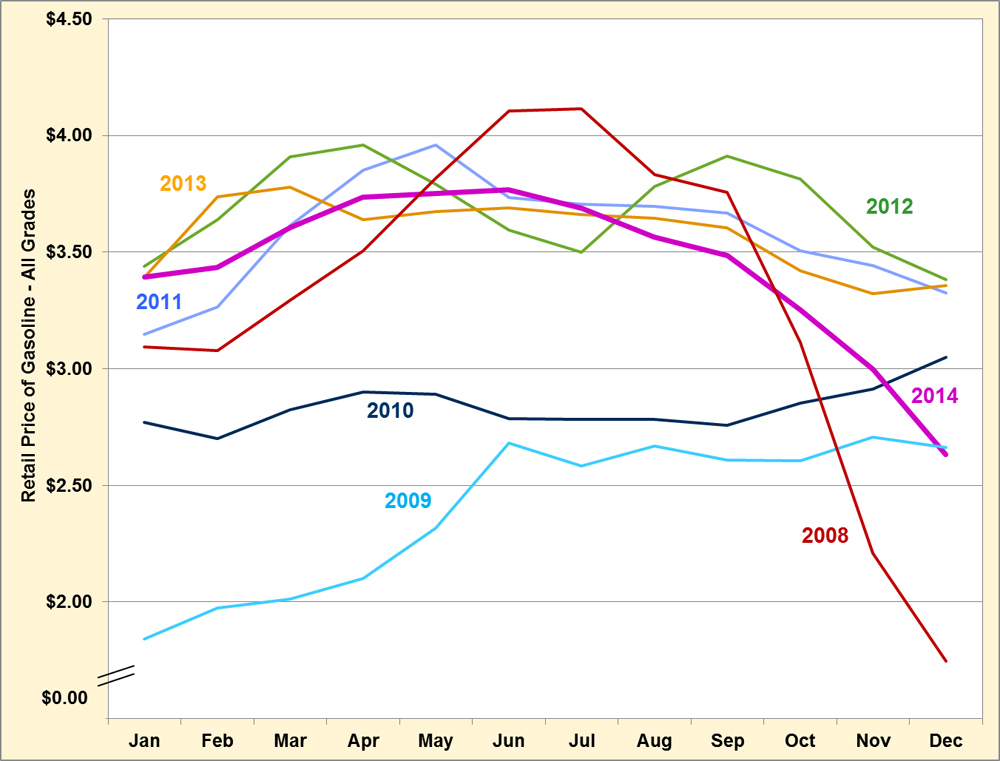
In the second half of 2014, the national average retail price per gallon of gasoline (all grades) fell from a high of $3.77 in June to a low of $2.63 in December – a difference of $1.14 per gallon. This is the largest price drop since the recession of 2008 where a loss of demand led to collapsing fuel prices. The price of gasoline is highly volatile and often varies substantially throughout any given year. The year 2010 is an exception with a modest price variation and gasoline prices remaining under $3.00 per gallon for almost the entire year.
National Average Retail Price of Gasoline (All grades) by Month, 2008 – 2014
(Dollars per Gallon)
Image
Supporting Information
| Month | Year | ||||||
|---|---|---|---|---|---|---|---|
| 2008 | 2009 | 2010 | 2011 | 2012 | 2013 | 2014 | |
| Jan | 3.10 | 1.84 | 2.77 | 3.15 | 3.44 | 3.39 | 3.39 |
| Feb | 3.08 | 1.98 | 2.70 | 3.26 | 3.64 | 3.74 | 3.43 |
| Mar | 3.29 | 2.01 | 2.82 | 3.62 | 3.91 | 3.78 | 3.61 |
| Apr | 3.51 | 2.10 | 2.90 | 3.85 | 3.96 | 3.64 | 3.74 |
| May | 3.82 | 2.32 | 2.89 | 3.96 | 3.79 | 3.68 | 3.75 |
| Jun | 4.11 | 2.68 | 2.79 | 3.74 | 3.60 | 3.69 | 3.77 |
| Jul | 4.11 | 2.58 | 2.78 | 3.71 | 3.50 | 3.66 | 3.69 |
| Aug | 3.83 | 2.67 | 2.78 | 3.70 | 3.78 | 3.65 | 3.57 |
| Sep | 3.76 | 2.61 | 2.76 | 3.67 | 3.91 | 3.60 | 3.48 |
| Oct | 3.11 | 2.61 | 2.85 | 3.51 | 3.81 | 3.42 | 3.26 |
| Nov | 2.21 | 2.71 | 2.91 | 3.44 | 3.52 | 3.32 | 3.00 |
| Dec | 1.75 | 2.66 | 3.05 | 3.33 | 3.38 | 3.36 | 2.63 |
Source: Energy Information Administration, U.S. All Grades All Formulations Retail Gasoline Prices (Dollars per Gallon), accessed 01/22/2015. | |||||||