
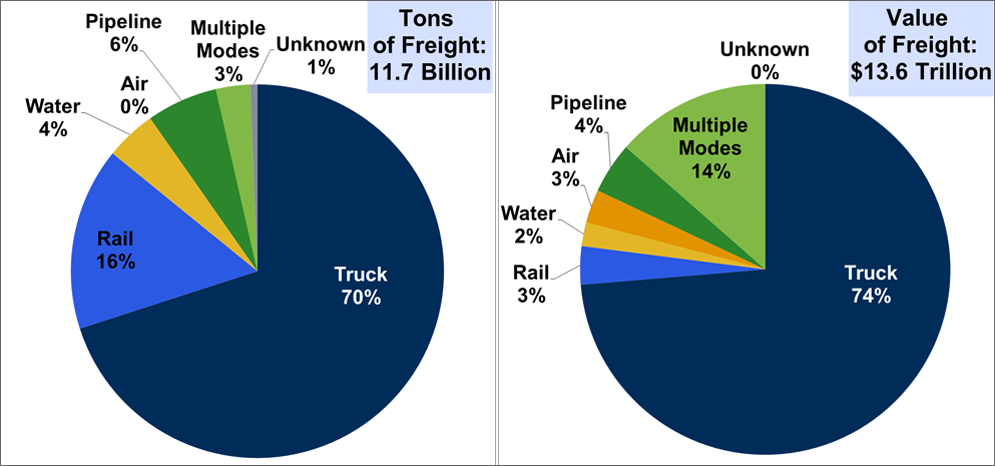
According to the preliminary 2012 Commodity Flow Survey (CFS) data, trucks transport the vast majority of freight by both weight and value. The two pie charts below show the share of freight moved by each transportation mode by weight (left) and by value (right). By weight, rail transports 16% of the freight but only 3% by value because rail is often used to haul bulk commodities like coal and grains that are heavy but low value. Conversely, air transport carries just 0.04% (rounds to 0% in the pie chart) of the freight by weight but 3% of the freight by value because lightweight, high value commodities are often shipped by air.
Notes:
- Air transport includes truck and air.
- The CFS data for pipeline exclude most shipments of crude oil.
- Multiple modes includes data for parcel, U.S. Postal Service, or courier; truck and rail; truck and water; rail and water; and other multiple modes.
Supporting Information
| Mode | Weight (Million Tons) | Share of Tons | Value (Billion 2012 Dollars) | Share of Dollars |
|---|---|---|---|---|
| Truck | 8,190.1 | 70% | 10,038.1 | 74% |
| Rail | 1,851.3 | 16% | 455.1 | 3% |
| Water | 510.7 | 4% | 280.9 | 2% |
| Air | 4.7 | 0% | 397.4 | 3% |
| Pipeline | 720.1 | 6% | 607.2 | 4% |
| Multiple Modes | 347.8 | 3% | 1,844.2 | 14% |
| Unknown | 70.9 | 1% | 2.0 | 0% |
| Total | 11,695.6 | 100% | 13,625.1 | 100% |
Source: U.S. Department of Transportation, Bureau of Transportation Statistics, Commodity Flow Survey Preliminary Tables, December 2013. | ||||