
Electricity generated from sources that are renewable – hydroelectric power, bio-fuels, geothermal, solar, wind, wood, waste – have grown 150% from 1980 to 2011 (latest year available). Of the selected countries/regions shown, Europe has consistently had the highest consumption of renewable electricity. However, China has shown dramatic growth in the consumption of renewable electricity, overtaking the United States in 2005 and approaching levels that are closer to those of Europe by 2011. Although the growth in renewable electricity consumption in the U.S. appears modest compared to China and Europe, the U.S. has seen an increase of about 85% from 1980 to 2011.
Renewable Electricity Net Consumption for Selected Countries/Regions, 1980 - 2011
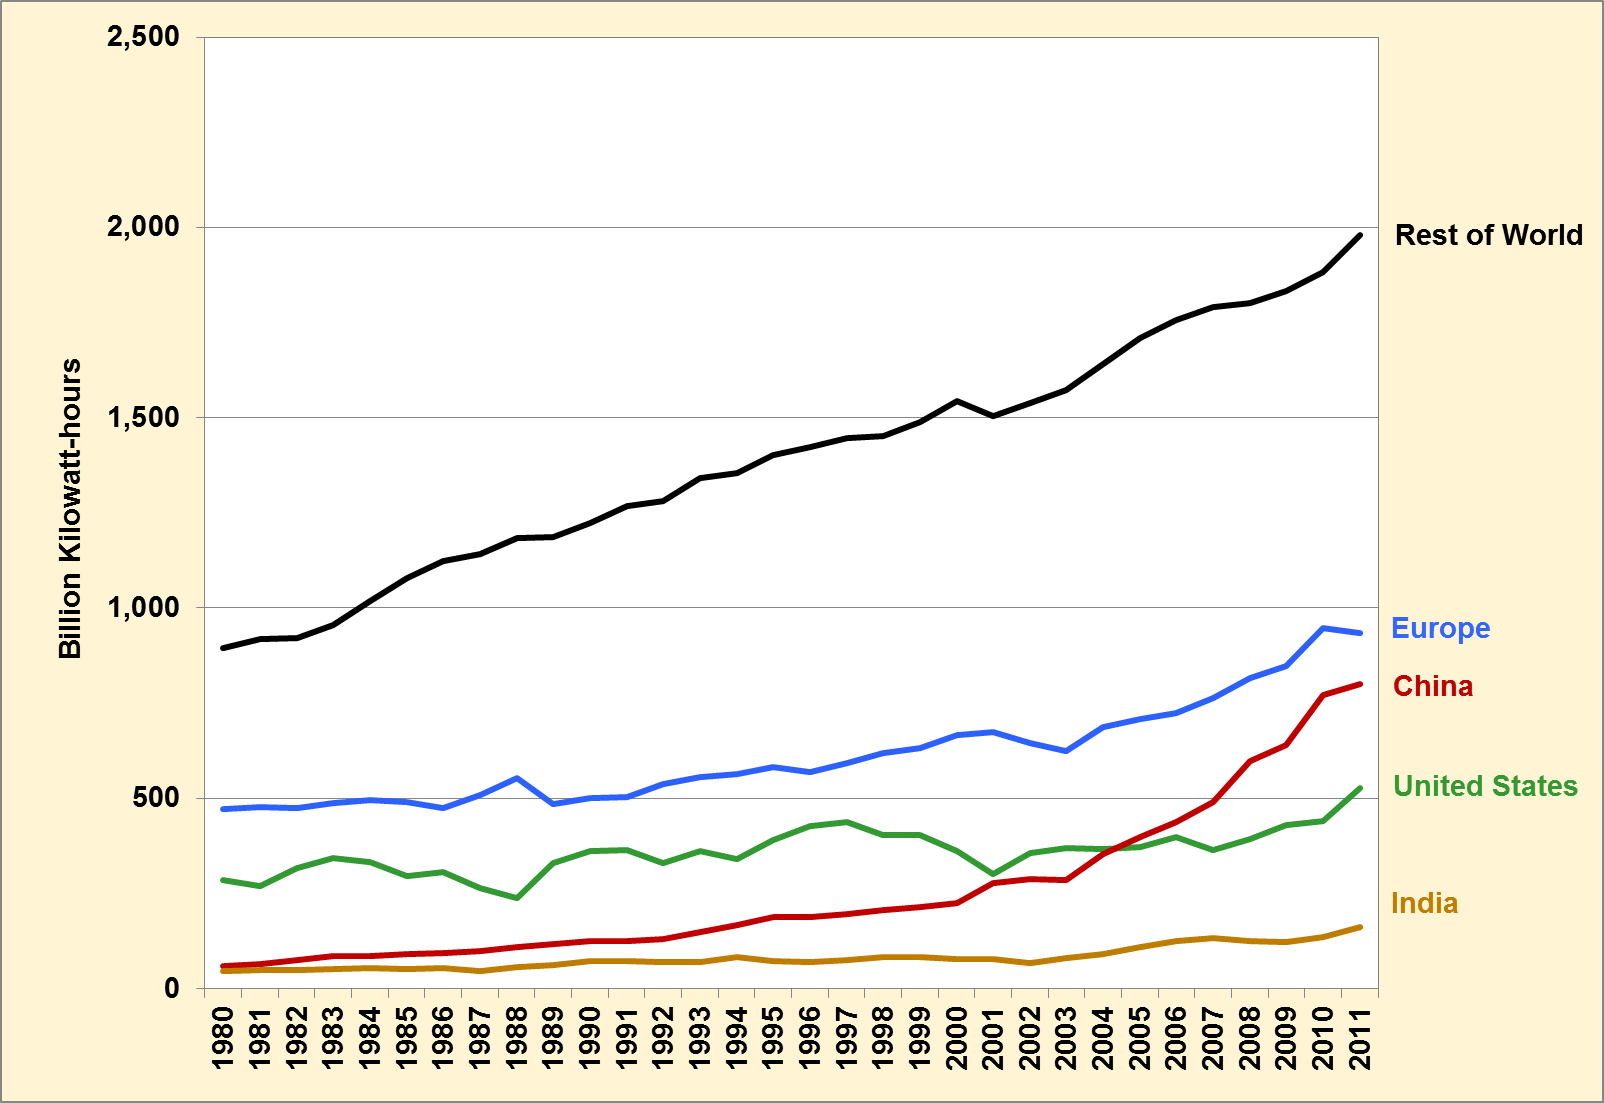
Note: Renewable electricity is generated from hydroelectric power, bio-fuels, geothermal, solar, wind, wood, and waste.
Supporting Information
| Year | (Billion Kilowatt-hours) | |||||
|---|---|---|---|---|---|---|
| United States | Europe | China | India | Rest of World | World Total | |
| 1980 | 284.69 | 471.88 | 57.62 | 46.54 | 893.17 | 1,753.89 |
| 1980 | 284.69 | 471.88 | 57.62 | 46.54 | 893.17 | 1,753.89 |
| 1981 | 269.90 | 477.69 | 64.85 | 49.56 | 917.39 | 1,779.38 |
| 1982 | 317.54 | 473.44 | 73.66 | 48.31 | 920.23 | 1,833.17 |
| 1983 | 341.75 | 486.57 | 85.54 | 49.87 | 954.37 | 1,918.09 |
| 1984 | 332.95 | 495.14 | 85.93 | 53.41 | 1,018.07 | 1,985.49 |
| 1985 | 295.04 | 490.97 | 91.48 | 50.51 | 1,078.20 | 2,006.19 |
| 1986 | 305.51 | 474.92 | 93.56 | 53.31 | 1,123.88 | 2,051.17 |
| 1987 | 265.12 | 508.66 | 99.20 | 47.00 | 1,141.37 | 2,061.35 |
| 1988 | 238.09 | 552.43 | 108.01 | 57.30 | 1,184.81 | 2,140.63 |
| 1989 | 329.16 | 484.14 | 117.22 | 61.52 | 1,185.25 | 2,177.28 |
| 1990 | 360.85 | 499.65 | 125.14 | 70.97 | 1,222.42 | 2,279.03 |
| 1991 | 362.51 | 502.87 | 123.86 | 72.09 | 1,267.16 | 2,328.49 |
| 1992 | 330.58 | 535.96 | 130.20 | 69.28 | 1,279.78 | 2,345.79 |
| 1993 | 360.19 | 556.04 | 149.22 | 69.87 | 1,341.20 | 2,476.52 |
| 1994 | 340.33 | 564.59 | 165.74 | 82.10 | 1,354.72 | 2,507.48 |
| 1995 | 388.90 | 580.85 | 187.87 | 72.40 | 1,402.48 | 2,632.50 |
| 1996 | 426.53 | 569.64 | 186.58 | 69.17 | 1,423.23 | 2,675.15 |
| 1997 | 437.25 | 591.59 | 195.45 | 74.96 | 1,446.32 | 2,745.56 |
| 1998 | 404.00 | 619.59 | 205.01 | 83.31 | 1,450.92 | 2,762.81 |
| 1999 | 402.98 | 630.98 | 213.72 | 82.39 | 1,489.60 | 2,819.67 |
| 2000 | 361.27 | 666.16 | 223.25 | 76.76 | 1,544.27 | 2,871.71 |
| 2001 | 299.64 | 673.99 | 277.87 | 77.03 | 1,503.92 | 2,832.45 |
| 2002 | 356.96 | 643.73 | 288.44 | 68.00 | 1,539.52 | 2,896.66 |
| 2003 | 369.34 | 623.91 | 284.37 | 80.06 | 1,571.60 | 2,929.27 |
| 2004 | 365.72 | 687.18 | 353.82 | 90.28 | 1,639.63 | 3,136.63 |
| 2005 | 370.47 | 707.54 | 397.67 | 109.26 | 1,709.86 | 3,294.79 |
| 2006 | 398.75 | 724.56 | 437.90 | 123.24 | 1,757.20 | 3,441.65 |
| 2007 | 364.98 | 763.82 | 488.73 | 133.17 | 1,790.22 | 3,540.93 |
| 2008 | 392.74 | 816.66 | 596.79 | 124.87 | 1,800.88 | 3,731.93 |
| 2009 | 429.65 | 847.55 | 639.28 | 123.03 | 1,831.92 | 3,871.43 |
| 2010 | 440.23 | 946.92 | 770.92 | 135.27 | 1,883.72 | 4,177.06 |
| 2011 | 527.49 | 933.35 | 800.97 | 160.36 | 1,980.26 | 4,402.43 |
| Source: Energy Information Administration, International Energy Statistics, accessed August 2014. | ||||||