
In 1970, about 15% of all cars sold were imported (built outside of North America) and about 5% of all light trucks sold were imported. These import shares grew during the 1970’s and the early 1980’s. Following sharp declines in the late 1980s through the mid-1990s, import shares of both cars and light trucks rebounded, with import cars reaching a peak of just over 34% in 2009. Import light trucks reached their peak share in 1981 at almost 27% but accounted for just 16% in 2013. Import medium and heavy trucks have always represented a small percentage of the medium and heavy truck market totaling just 3.1% in 2013.
Import Market Share of Cars, Light Trucks, and Medium and Heavy Trucks, 1970 - 2013
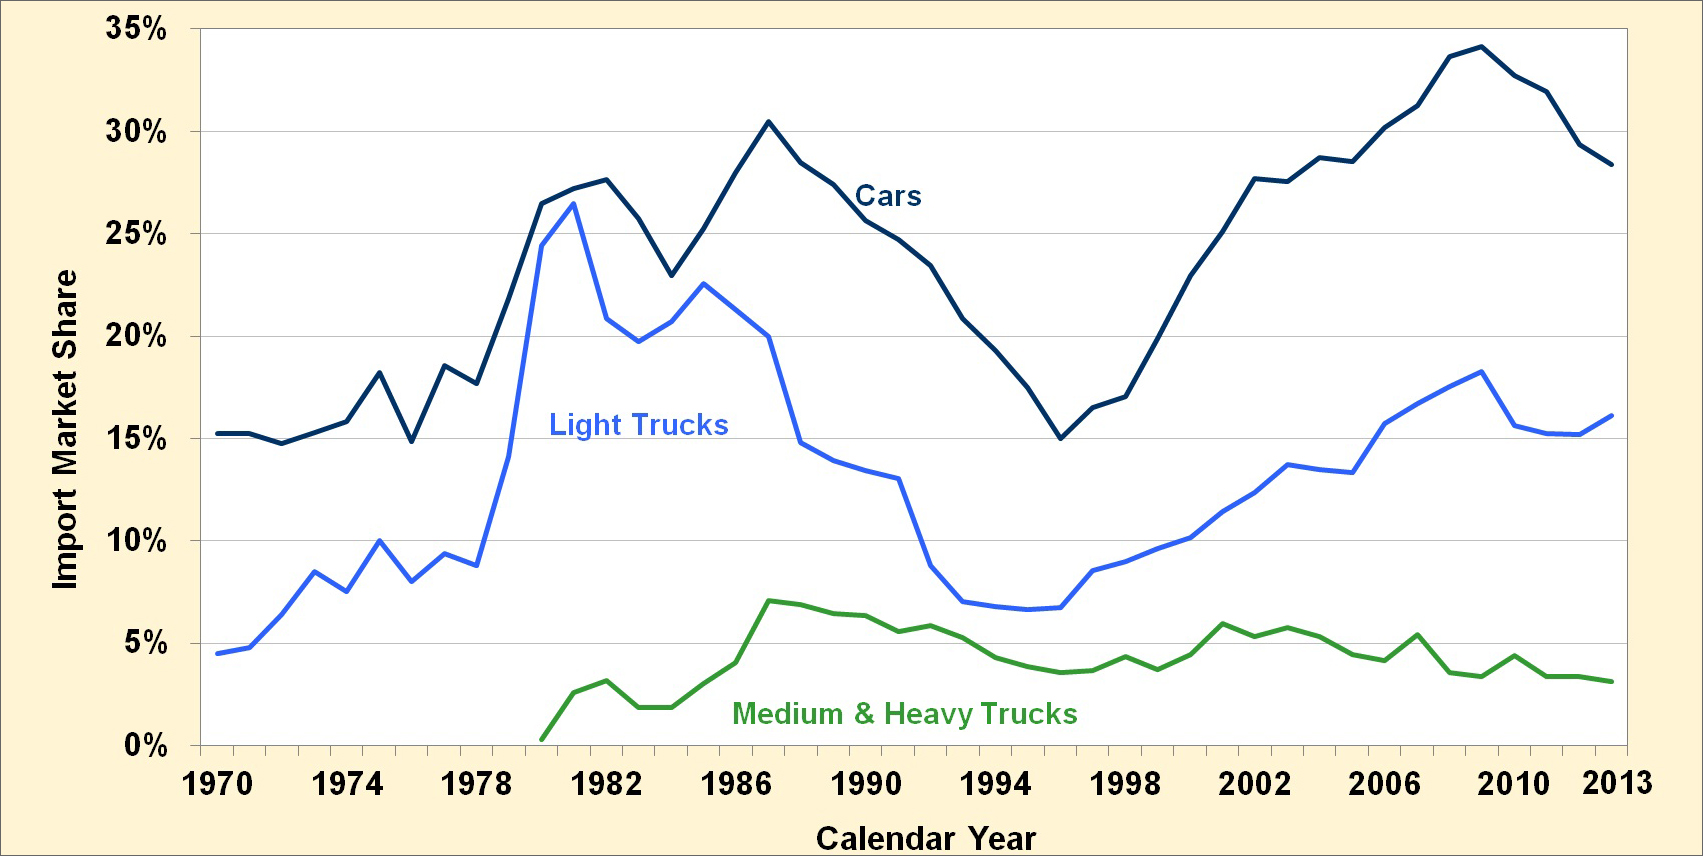
Note: Imported vehicles include any vehicle built outside of North America regardless of manufacturer. Data for Medium and Heavy Trucks before 1980 are not available.
Supporting Information
| Calendar Year | Cars | Light Trucks | Medium & Heavy Trucks |
|---|---|---|---|
| 1970 | 15.2% | 4.5% | Not available |
| 1971 | 15.2% | 4.8% | Not available |
| 1972 | 14.8% | 6.4% | Not available |
| 1973 | 15.3% | 8.5% | Not available |
| 1974 | 15.8% | 7.5% | Not available |
| 1975 | 18.2% | 10.0% | Not available |
| 1976 | 14.8% | 8.0% | Not available |
| 1977 | 18.5% | 9.4% | Not available |
| 1978 | 17.7% | 8.8% | Not available |
| 1979 | 21.8% | 14.1% | Not available |
| 1980 | 26.5% | 24.4% | 0.3% |
| 1981 | 27.2% | 26.5% | 2.6% |
| 1982 | 27.6% | 20.9% | 3.2% |
| 1983 | 25.7% | 19.7% | 1.8% |
| 1984 | 23.0% | 20.7% | 1.8% |
| 1985 | 25.3% | 22.6% | 3.0% |
| 1986 | 28.0% | 21.3% | 4.1% |
| 1987 | 30.5% | 20.0% | 7.1% |
| 1988 | 28.5% | 14.8% | 6.9% |
| 1989 | 27.4% | 13.9% | 6.4% |
| 1990 | 25.6% | 13.5% | 6.3% |
| 1991 | 24.7% | 13.1% | 5.6% |
| 1992 | 23.5% | 8.8% | 5.8% |
| 1993 | 20.9% | 7.1% | 5.3% |
| 1994 | 19.3% | 6.8% | 4.3% |
| 1995 | 17.5% | 6.6% | 3.9% |
| 1996 | 15.0% | 6.7% | 3.6% |
| 1997 | 16.5% | 8.5% | 3.7% |
| 1998 | 17.1% | 9.0% | 4.4% |
| 1999 | 19.9% | 9.6% | 3.7% |
| 2000 | 23.0% | 10.2% | 4.5% |
| 2001 | 25.1% | 11.4% | 6.0% |
| 2002 | 27.7% | 12.4% | 5.3% |
| 2003 | 27.6% | 13.7% | 5.7% |
| 2004 | 28.7% | 13.5% | 5.3% |
| 2005 | 28.5% | 13.3% | 4.4% |
| 2006 | 30.2% | 15.7% | 4.2% |
| 2007 | 31.3% | 16.7% | 5.4% |
| 2008 | 33.7% | 17.6% | 3.6% |
| 2009 | 34.1% | 18.3% | 3.4% |
| 2010 | 32.7% | 15.6% | 4.4% |
| 2011 | 32.0% | 15.2% | 3.4% |
| 2012 | 29.3% | 15.2% | 3.4% |
| 2013 | 28.4% | 16.1% | 3.1% |
| Source: Ward's Automotive, 2014. | |||