
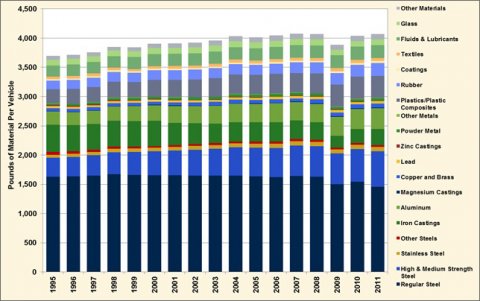
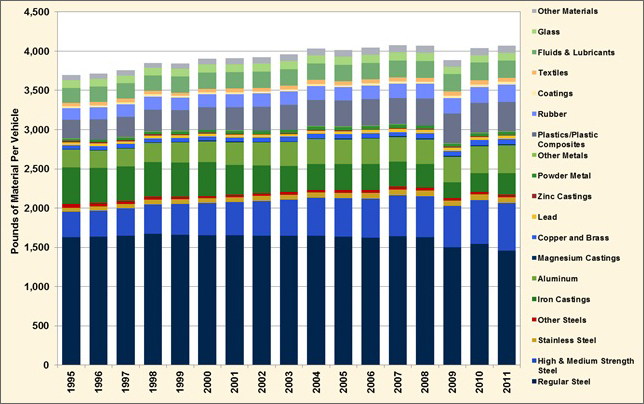
As automakers strive to improve fuel economy, they have turned increasingly to lightweight materials to reduce overall vehicle weight. For example, most light vehicle engine blocks are now made of aluminum rather than cast iron, and in many cases, aluminum wheels have replaced heavier steel wheels as standard equipment. Use of regular steel has declined by an average of 172 pounds per vehicle from 1995 to 2011 while the use of high and medium strength steels has increased by 284 lbs. per vehicle. The increased use of high and medium strength steel is significant because it allows manufacturers to improve the structural integrity of vehicles while keeping the overall vehicle weight to a minimum. The use of plastics and composites has also increased by 57% and lightweight magnesium castings have seen greater use in dashboards and other interior applications such as seat components, replacing the heavier steel components that were previously used.
Average Material Content of Light Vehicles, 1995-2011
Image
Supporting Information
| Material | 1995 | 1996 | 1997 | 1998 | 1999 | 2000 | 2001 | 2002 | 2003 | 2004 | 2005 | 2006 | 2007 | 2008 | 2009 | 2010 | 2011 |
|---|---|---|---|---|---|---|---|---|---|---|---|---|---|---|---|---|---|
| Regular Steel | 1,630 | 1,636 | 1,649 | 1,669 | 1,662 | 1,655 | 1,652 | 1,649 | 1,646 | 1,650 | 1,634 | 1,622 | 1,644 | 1,629 | 1,501 | 1,542 | 1,458 |
| High & Medium Strength Steel | 324 | 333 | 346 | 378 | 390 | 408 | 424 | 443 | 460 | 479 | 491 | 500 | 518 | 523 | 524 | 559 | 608 |
| Stainless Steel | 51 | 53 | 55 | 59 | 60 | 62 | 63 | 64 | 65 | 70 | 71 | 73 | 75 | 75 | 69 | 73 | 73 |
| Other Steels | 46 | 44 | 42 | 40 | 30 | 26 | 28 | 30 | 32 | 34 | 35 | 35 | 34 | 34 | 31 | 33 | 32 |
| Iron Castings | 466 | 444 | 438 | 438 | 436 | 432 | 384 | 355 | 336 | 331 | 328 | 331 | 322 | 301 | 206 | 237 | 275 |
| Aluminum | 231 | 224 | 227 | 245 | 257 | 268 | 286 | 294 | 303 | 315 | 316 | 323 | 313 | 315 | 324 | 344 | 355 |
| Magnesium Castings | 4 | 6 | 6 | 7 | 7 | 8 | 10 | 9 | 10 | 10 | 10 | 10 | 10 | 11 | 12 | 13 | 12 |
| Copper and Brass | 50 | 51 | 53 | 53 | 52 | 52 | 53 | 55 | 57 | 59 | 59 | 61 | 53 | 64 | 63 | 65 | 67 |
| Lead | 33 | 34 | 35 | 35 | 35 | 36 | 37 | 35 | 35 | 37 | 37 | 39 | 42 | 45 | 42 | 40 | 41 |
| Zinc Castings | 19 | 19 | 18 | 17 | 14 | 13 | 11 | 10 | 10 | 10 | 10 | 10 | 9 | 10 | 9 | 9 | 9 |
| Powder Metal | 29 | 28 | 31 | 33 | 35 | 36 | 38 | 39 | 41 | 43 | 42 | 42 | 43 | 43 | 41 | 41 | 41 |
| Other Metals | 4 | 4 | 4 | 4 | 4 | 4 | 4 | 4 | 4 | 5 | 4 | 5 | 5 | 5 | 5 | 6 | 5 |
| Plastics/Plastic Composites | 240 | 257 | 260 | 278 | 265 | 286 | 298 | 307 | 319 | 337 | 332 | 338 | 331 | 343 | 376 | 378 | 377 |
| Rubber | 149 | 154 | 158 | 166 | 159 | 166 | 163 | 167 | 171 | 173 | 173 | 174 | 189 | 185 | 198 | 200 | 222 |
| Coatings | 23 | 25 | 24 | 26 | 24 | 25 | 26 | 26 | 25 | 28 | 27 | 29 | 29 | 28 | 34 | 34 | 34 |
| Textiles | 42 | 41 | 47 | 43 | 42 | 44 | 45 | 45 | 46 | 51 | 48 | 48 | 46 | 48 | 52 | 54 | 48 |
| Fluids & Lubricants | 192 | 198 | 199 | 201 | 204 | 207 | 208 | 209 | 210 | 210 | 210 | 211 | 215 | 214 | 219 | 226 | 223 |
| Glass | 97 | 99 | 100 | 99 | 101 | 103 | 104 | 104 | 105 | 105 | 104 | 105 | 106 | 106 | 93 | 94 | 98 |
| Other Materials | 64 | 65 | 65 | 58 | 66 | 71 | 75 | 79 | 83 | 87 | 86 | 88 | 92 | 91 | 90 | 92 | 94 |
| Total | 3,694 | 3,715 | 3,757 | 3,849 | 3,843 | 3,902 | 3,909 | 3,924 | 3,958 | 4,034 | 4,017 | 4,044 | 4,076 | 4,070 | 3,889 | 4,040 | 4,072 |
| Source: Oak Ridge National Laboratory, 2012 Vehicle Technologies Market Report, February 2013, accessed May 30, 2013 and Wards Communications. | |||||||||||||||||