
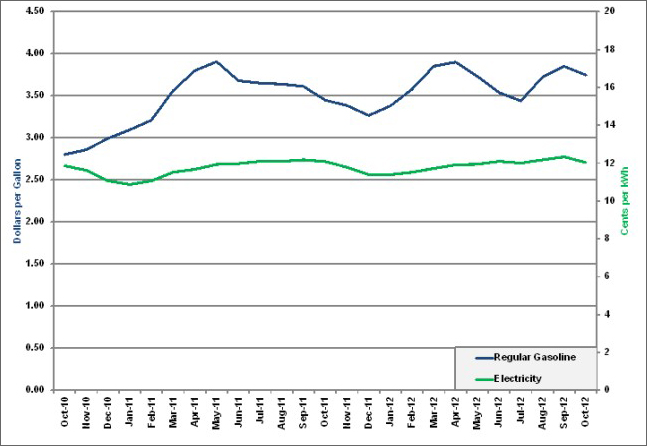
All energy prices vary from month to month and year to year. However, when comparing the national average retail price for a gallon of regular gasoline and a kilowatt-hour (kWh) for residential electricity, the pricing for gasoline is far more volatile. In the two year period shown in the figure below, electricity prices varied by approximately 11% from 11.06 cents to 12.33 cents per kWh. For the same period, gasoline prices varied by approximately 40% from $2.80 to $3.91 dollars per gallon.
National Average Retail Price for Regular Gasoline and Residential Electricity,
October 2010 – October 2012
Image

Image
Supporting Information
| Date | Gasoline (Dollars per gallon) | Electricity (Cents per kWh) |
|---|---|---|
| Oct-10 | 2.80 | 11.86 |
| Nov-10 | 2.86 | 11.62 |
| Dec-10 | 2.99 | 11.06 |
| Jan-11 | 3.10 | 10.87 |
| Feb-11 | 3.21 | 11.06 |
| Mar-11 | 3.56 | 11.52 |
| Apr-11 | 3.80 | 11.67 |
| May-11 | 3.91 | 11.93 |
| Jun-11 | 3.68 | 11.97 |
| Jul-11 | 3.65 | 12.09 |
| Aug-11 | 3.64 | 12.09 |
| Sep-11 | 3.61 | 12.17 |
| Oct-11 | 3.45 | 12.08 |
| Nov-11 | 3.38 | 11.78 |
| Dec-11 | 3.27 | 11.40 |
| Jan-12 | 3.38 | 11.39 |
| Feb-12 | 3.58 | 11.52 |
| Mar-12 | 3.85 | 11.72 |
| Apr-12 | 3.90 | 11.91 |
| May-12 | 3.73 | 11.94 |
| Jun-12 | 3.54 | 12.09 |
| Jul-12 | 3.44 | 12.00 |
| Aug-12 | 3.72 | 12.17 |
| Sep-12 | 3.85 | 12.33 |
| Oct-12 | 3.75 | 12.03 |
| Source: U.S. Energy Information Administration, Average Retail Price of Electricity to Ultimate Customers, U.S. Monthly Retail Gasoline Prices | ||