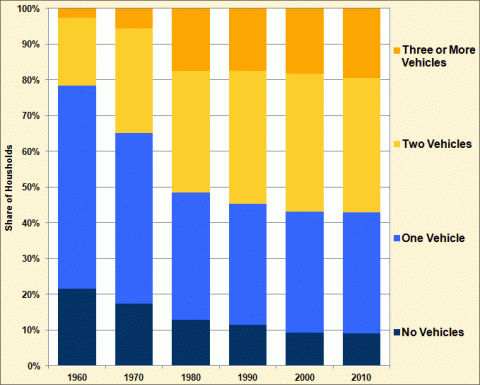
Household vehicle ownership has changed over the last six decades. In 1960, over twenty percent of households did not own a vehicle, but by 2010, that number fell to less than 10%. The number of households with three or more vehicles grew from 2% in 1960 to nearly 20% in 2010. Before 1990, the most common number of vehicles per household was one, but since 1990, the most common number of vehicles is two. Starting in 1980, more than 50% of American households owned two or more vehicles.
Household Vehicle Ownership, 1960-2010
Supporting Information
| Year | No Vehicles | One Vehicle | Two Vehicles | Three or More Vehicles |
|---|---|---|---|---|
| 1960 | 21.5% | 56.9% | 19.0% | 2.5% |
| 1970 | 17.5% | 47.7% | 29.3% | 5.5% |
| 1980 | 12.9% | 35.5% | 34.0% | 17.5% |
| 1990 | 11.5% | 33.7% | 37.4% | 17.3% |
| 2000 | 9.4% | 33.8% | 38.6% | 18.3% |
| 2010 | 9.1% | 33.8% | 37.6% | 19.5% |
Sources: | ||||


