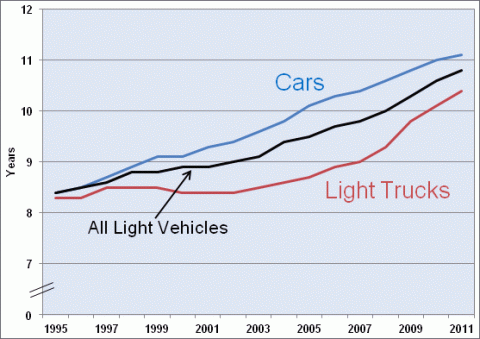
The average age for cars and light trucks continues to rise as consumers hold onto their vehicles longer. Between 1995 and 2011, the average age for cars increased by 32% from 8.4 years to 11.1 years. For light trucks, the average age increased by 25% during that same period from 8.3 years to 10.4 years. The popularity of SUVs and minivans through the 1990s resulted in more new truck sales, bringing down the average age for all light trucks as shown in the figure below.
Average Age of Cars and Light Trucks, 1995-2011
Supporting Information
| Year | Passenger Cars | Light Trucks | Total Light Vehicles |
|---|---|---|---|
| 1995 | 8.4 | 8.3 | 8.4 |
| 1996 | 8.5 | 8.3 | 8.5 |
| 1997 | 8.7 | 8.5 | 8.6 |
| 1998 | 8.9 | 8.5 | 8.8 |
| 1999 | 9.1 | 8.5 | 8.8 |
| 2000 | 9.1 | 8.4 | 8.9 |
| 2001 | 9.3 | 8.4 | 8.9 |
| 2002 | 9.4 | 8.4 | 9.0 |
| 2003 | 9.6 | 8.5 | 9.1 |
| 2004 | 9.8 | 8.6 | 9.4 |
| 2005 | 10.1 | 8.7 | 9.5 |
| 2006 | 10.3 | 8.9 | 9.7 |
| 2007 | 10.4 | 9.0 | 9.8 |
| 2008 | 10.6 | 9.3 | 10.0 |
| 2009 | 10.8 | 9.8 | 10.3 |
| 2010 | 11.0 | 10.1 | 10.6 |
| 2011 | 11.1 | 10.4 | 10.8 |


