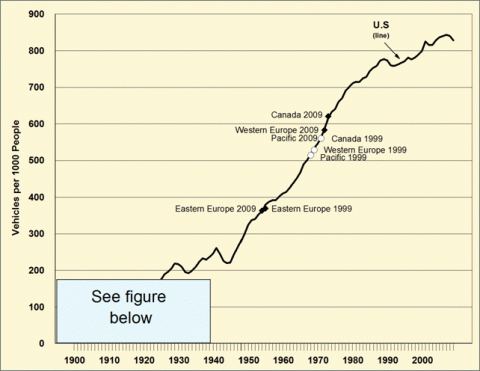
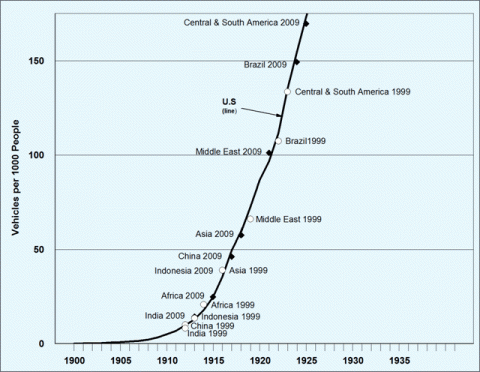
The U S. data for vehicles per thousand people are displayed in the line which goes from 1900 to 2009. The points labeled on that line show data for other countries/regions around the world and how their vehicles per thousand people compare to the U.S. at two different points in time, 1999 and 2009. For instance, the graph shows that in 1999 Western Europe's vehicles per thousand people was about where the U.S. was in 1969, but by 2009 it was about where the U.S. was in 1972. The lower part of the graph is enlarged below, showing that China moved from where the U.S. was in 1912 to where the U.S. was in 1917.
Vehicles per Thousand People: US (Over Time) Compared to Other Countries/Regions
Enlarged bottom left of graph
Supporting Information
| Country/Region | Vehicles per 1,000 people | |
|---|---|---|
| 1999 | 2009 | |
| Africa | 20.9 | 24.9 |
| Asia, Far East | 39.1 | 157.7 |
| Asia, Middle East | 66.2 | 101.2 |
| Brazil | 107.5 | 149.2 |
| Canada | 560 | 620.9 |
| Central & South America | 133.6 | 169.7 |
| China | 10.2 | 46.2 |
| Europe, East | 370 | 363.9 |
| Europe, West | 528.8 | 583.3 |
| India | 8.3 | 14.4 |
| Indonesia | 13.7 | 35.9 |
| Pacific | 513.9 | 560.9 |
Source: Oak Ridge National Laboratory, Transportation Energy Data Book: Edition 30, ORNL-6986, June 2011. | ||
| Year | U.S. vehicles per 1,000 people | Year | U.S. vehicles per 1,000 people | Year | U.S. vehicles per 1,000 people | Year | U.S. vehicles per 1,000 people | Year | U.S. vehicles per 1,000 people |
|---|---|---|---|---|---|---|---|---|---|
| 1900 | 0.11 | 1922 | 111.53 | 1944 | 220.23 | 1966 | 489.34 | 1988 | 772.92 |
| 1901 | 0.19 | 1923 | 134.90 | 1945 | 221.80 | 1967 | 500.66 | 1989 | 776.99 |
| 1902 | 0.29 | 1924 | 154.35 | 1946 | 243.11 | 1968 | 516.49 | 1990 | 773.40 |
| 1903 | 0.41 | 1925 | 173.26 | 1947 | 262.56 | 1969 | 533.37 | 1991 | 760.19 |
| 1904 | 0.67 | 1926 | 189.10 | 1948 | 280.20 | 1970 | 545.35 | 1992 | 757.96 |
| 1905 | 0.94 | 1927 | 195.77 | 1949 | 299.56 | 1971 | 562.45 | 1993 | 761.94 |
| 1906 | 1.27 | 1928 | 204.87 | 1950 | 323.71 | 1972 | 585.60 | 1994 | 766.94 |
| 1907 | 1.65 | 1929 | 219.31 | 1951 | 337.14 | 1973 | 615.19 | 1995 | 770.99 |
| 1908 | 2.24 | 1930 | 217.34 | 1952 | 340.57 | 1974 | 632.32 | 1996 | 781.16 |
| 1909 | 3.45 | 1931 | 210.37 | 1953 | 353.67 | 1975 | 640.07 | 1997 | 776.02 |
| 1910 | 5.07 | 1932 | 195.38 | 1954 | 361.40 | 1976 | 659.47 | 1998 | 781.20 |
| 1911 | 6.81 | 1933 | 192.38 | 1955 | 379.77 | 1977 | 669.03 | 1999 | 790.07 |
| 1912 | 9.90 | 1934 | 199.90 | 1956 | 387.58 | 1978 | 690.17 | 2000 | 800.30 |
| 1913 | 12.94 | 1935 | 208.61 | 1957 | 392.11 | 1979 | 700.42 | 2001 | 825.49 |
| 1914 | 17.79 | 1936 | 222.62 | 1958 | 392.17 | 1980 | 710.71 | 2002 | 815.22 |
| 1915 | 24.77 | 1937 | 233.33 | 1959 | 402.83 | 1981 | 715.22 | 2003 | 815.50 |
| 1916 | 35.48 | 1938 | 229.65 | 1960 | 410.37 | 1982 | 713.95 | 2004 | 829.26 |
| 1917 | 49.57 | 1939 | 236.93 | 1961 | 415.11 | 1983 | 724.30 | 2005 | 836.58 |
| 1918 | 59.69 | 1940 | 245.63 | 1962 | 426.06 | 1984 | 728.20 | 2006 | 840.09 |
| 1919 | 72.50 | 1941 | 261.57 | 1963 | 438.75 | 1985 | 744.50 | 2007 | 843.57 |
| 1920 | 86.78 | 1942 | 244.73 | 1964 | 451.57 | 1986 | 753.33 | 2008 | 840.80 |
| 1921 | 96.68 | 1943 | 225.89 | 1965 | 466.90 | 1987 | 758.58 | 2009 | 828.04 |
Source: Oak Ridge National Laboratory, Transportation Energy Data Book: Edition 30, ORNL-6986, June 2011. | |||||||||


