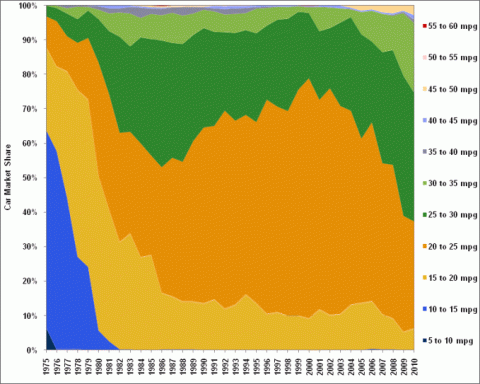
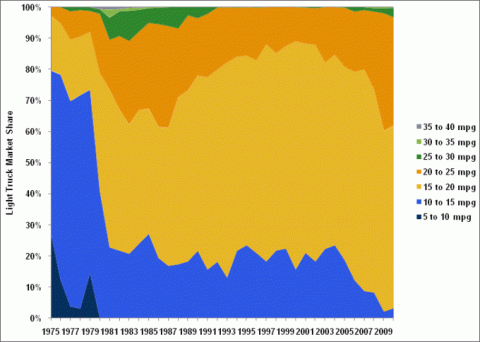
Nearly 64% of new cars sold in model year (MY) 1975 had combined highway/city fuel economy of 15 miles per gallon (mpg) or less [blue shading]. By 2010, 63% of cars had fuel economy of 25 mpg or higher [green shading and up]. Light trucks, which typically have lower fuel economy than cars, show a drastic change in the market in the early 1980's – moving towards new light trucks with 15-20 mpg. While the majority of light trucks sold are still in the 15-20 mpg range, more than 37% in 2009 and 2010 were 20 mpg or higher.
New Car Market Share by Fuel Economy, MY1975-2010
New Light Truck Market Share by Fuel Economy, MY1975-2010
Supporting Information
| Model Year | 5-10 mpg | 10-15 mpg | 15-20 mpg | 20-25 mpg | 25-30 mpg | 30-35 mpg | 35-40 mpg | 40-45 mpg | 45-50 mpg | 50-55 mpg | 55-60 mpg |
|---|---|---|---|---|---|---|---|---|---|---|---|
| 1975 | 6.6% | 57.3% | 23.9% | 9.0% | 3.1% | ||||||
| 1976 | 0.2% | 57.6% | 24.4% | 13.2% | 3.8% | 0.7% | |||||
| 1977 | 0.2% | 44.0% | 36.7% | 10.2% | 6.6% | 1.5% | 0.8% | ||||
| 1978 | 0.3% | 26.8% | 48.4% | 13.7% | 6.9% | 3.6% | 0.3% | ||||
| 1979 | 0.0% | 24.2% | 48.5% | 17.9% | 8.0% | 1.0% | 0.4% | ||||
| 1980 | 0.0% | 5.7% | 44.7% | 33.0% | 12.7% | 2.7% | 1.0% | 0.2% | |||
| 1981 | 0.0% | 2.6% | 38.1% | 33.6% | 18.4% | 5.1% | 1.5% | 0.8% | |||
| 1982 | 0.0% | 0.3% | 31.1% | 31.7% | 27.9% | 7.0% | 1.2% | 0.8% | |||
| 1983 | 0.0% | 0.3% | 33.6% | 29.5% | 24.8% | 9.5% | 1.9% | 0.4% | 0.0% | ||
| 1984 | 0.0% | 0.1% | 26.9% | 33.1% | 30.8% | 5.6% | 3.0% | 0.4% | 0.2% | ||
| 1985 | 0.0% | 0.1% | 27.5% | 28.9% | 33.8% | 7.3% | 1.5% | 0.4% | 0.5% | ||
| 1986 | 0.0% | 0.3% | 16.3% | 36.5% | 36.8% | 7.3% | 1.9% | 0.3% | 0.3% | 0.1% | 0.2% |
| 1987 | 0.0% | 0.3% | 15.3% | 40.3% | 33.4% | 8.7% | 1.6% | 0.0% | 0.3% | 0.2% | |
| 1988 | 0.0% | 0.3% | 13.8% | 40.6% | 34.2% | 8.2% | 2.5% | 0.0% | 0.2% | 0.2% | |
| 1989 | 0.0% | 0.3% | 13.8% | 46.6% | 30.8% | 6.2% | 1.9% | 0.0% | 0.3% | 0.1% | |
| 1990 | 0.0% | 0.2% | 13.4% | 51.1% | 28.9% | 5.3% | 0.7% | 0.1% | 0.3% | 0.1% | |
| 1991 | 0.0% | 0.2% | 14.5% | 50.4% | 27.3% | 5.9% | 0.9% | 0.7% | 0.1% | 0.0% | |
| 1992 | 0.0% | 0.2% | 11.8% | 57.5% | 22.8% | 5.1% | 1.6% | 0.8% | 0.1% | 0.1% | |
| 1993 | 0.0% | 0.1% | 13.1% | 53.4% | 25.5% | 5.5% | 1.6% | 0.7% | 0.0% | 0.1% | |
| 1994 | 0.1% | 16.1% | 52.1% | 24.6% | 4.9% | 1.5% | 0.6% | 0.0% | 0.1% | ||
| 1995 | 0.0% | 0.1% | 13.5% | 52.6% | 25.8% | 7.1% | 0.5% | 0.4% | 0.0% | ||
| 1996 | 0.1% | 10.4% | 62.2% | 21.5% | 5.1% | 0.4% | 0.3% | ||||
| 1997 | 0.1% | 10.9% | 59.7% | 25.2% | 3.7% | 0.2% | 0.2% | ||||
| 1998 | 0.1% | 9.9% | 59.4% | 26.8% | 3.4% | 0.1% | 0.3% | ||||
| 1999 | 0.1% | 9.9% | 65.6% | 22.6% | 1.6% | 0.1% | 0.1% | ||||
| 2000 | 0.0% | 0.0% | 9.2% | 69.8% | 19.0% | 1.6% | 0.2% | 0.2% | 0.1% | ||
| 2001 | 0.0% | 0.0% | 11.8% | 60.7% | 19.9% | 7.0% | 0.1% | 0.3% | 0.0% | 0.0% | |
| 2002 | 0.1% | 10.1% | 65.8% | 17.5% | 5.9% | 0.2% | 0.4% | 0.0% | 0.0% | ||
| 2003 | 0.0% | 0.1% | 10.4% | 60.3% | 24.2% | 4.1% | 0.0% | 0.8% | 0.0% | 0.0% | |
| 2004 | 0.1% | 13.1% | 56.3% | 27.2% | 2.2% | 0.2% | 0.3% | 0.6% | 0.0% | ||
| 2005 | 0.2% | 13.5% | 47.7% | 30.3% | 6.4% | 0.1% | 0.3% | 1.5% | 0.0% | ||
| 2006 | 0.4% | 13.8% | 51.9% | 23.5% | 8.9% | 0.0% | 0.4% | 1.1% | 0.0% | ||
| 2007 | 0.3% | 10.1% | 43.9% | 32.3% | 11.1% | 0.4% | 2.0% | ||||
| 2008 | 0.3% | 8.9% | 44.6% | 33.3% | 9.9% | 0.3% | 0.4% | 2.3% | |||
| 2009 | 0.2% | 5.1% | 33.7% | 40.7% | 18.1% | 0.4% | 0.3% | 1.5% | |||
| 2010 | 0.2% | 6.1% | 31.1% | 37.4% | 20.2% | 1.0% | 1.2% | 2.8% | |||
Source: U.S. Environmental Protection Agency, Light-Duty Automotive Technology, Carbon Dioxide Emissions, and Fuel Economy Trends: 1975 Through 2010, Appendix C. | |||||||||||
| Model Year | 5-10 mpg | 10-15 mpg | 15-20 mpg | 20-25 mpg | 25-30 mpg | 30-35 mpg | 35-40 mpg | 40-45 mpg | 45-50 mpg | 50-55 mpg | 55-60 mpg |
|---|---|---|---|---|---|---|---|---|---|---|---|
| 1975 | 27.6% | 52.1% | 17.9% | 2.5% | |||||||
| 1976 | 12.3% | 66.0% | 16.6% | 5.1% | |||||||
| 1977 | 3.8% | 66.0% | 19.8% | 9.1% | 1.3% | ||||||
| 1978 | 3.1% | 68.6% | 18.9% | 8.5% | 0.9% | ||||||
| 1979 | 14.4% | 59.1% | 18.6% | 6.7% | 1.2% | ||||||
| 1980 | 0.2% | 40.7% | 37.9% | 19.1% | 1.5% | 0.6% | |||||
| 1981 | 0.0% | 22.8% | 50.7% | 16.1% | 7.1% | 2.6% | 0.7% | ||||
| 1982 | 21.8% | 45.3% | 23.7% | 7.9% | 0.7% | 0.6% | |||||
| 1983 | 20.8% | 41.4% | 27.1% | 9.7% | 0.9% | 0.2% | |||||
| 1984 | 0.1% | 23.9% | 42.8% | 25.4% | 7.0% | 0.7% | 0.1% | ||||
| 1985 | 0.0% | 27.2% | 40.2% | 27.7% | 4.7% | 0.3% | 0.0% | ||||
| 1986 | 19.4% | 42.0% | 33.2% | 5.3% | 0.1% | 0.0% | |||||
| 1987 | 16.9% | 44.2% | 32.9% | 6.0% | 0.0% | 0.0% | |||||
| 1988 | 0.0% | 17.4% | 53.6% | 22.2% | 6.8% | ||||||
| 1989 | 18.3% | 54.9% | 24.2% | 2.6% | |||||||
| 1990 | 0.3% | 21.4% | 56.2% | 18.5% | 3.5% | ||||||
| 1991 | 15.7% | 61.8% | 20.5% | 2.1% | |||||||
| 1992 | 18.2% | 61.7% | 20.0% | 0.1% | |||||||
| 1993 | 13.1% | 69.1% | 17.8% | 0.0% | |||||||
| 1994 | 21.7% | 62.3% | 15.8% | 0.1% | |||||||
| 1995 | 23.5% | 60.8% | 15.6% | 0.0% | |||||||
| 1996 | 21.0% | 61.9% | 17.0% | 0.1% | |||||||
| 1997 | 18.3% | 69.8% | 11.9% | 0.0% | |||||||
| 1998 | 21.8% | 63.4% | 14.8% | 0.0% | |||||||
| 1999 | 22.4% | 65.1% | 12.4% | ||||||||
| 2000 | 15.7% | 73.4% | 10.9% | ||||||||
| 2001 | 21.1% | 67.3% | 11.6% | 0.1% | |||||||
| 2002 | 18.3% | 69.6% | 11.7% | 0.3% | |||||||
| 2003 | 22.3% | 59.8% | 17.8% | 0.0% | |||||||
| 2004 | 23.5% | 61.2% | 15.3% | ||||||||
| 2005 | 0.0% | 18.7% | 62.0% | 19.1% | 0.1% | ||||||
| 2006 | 0.0% | 12.3% | 66.8% | 19.4% | 1.4% | ||||||
| 2007 | 8.8% | 71.1% | 19.2% | 0.9% | |||||||
| 2008 | 8.3% | 65.1% | 25.1% | 1.1% | 0.3% | ||||||
| 2009 | 2.2% | 57.9% | 37.9% | 1.6% | 0.3% | ||||||
| 2010 | 3.3% | 58.5% | 35.0% | 3.0% | 0.2% | ||||||
Source: U.S. Environmental Protection Agency, Light-Duty Automotive Technology, Carbon Dioxide Emissions, and Fuel Economy Trends: 1975 Through 2010, Appendix C. | |||||||||||


