
The trade balance (exports minus imports) for petroleum has been negative for more than a quarter of a century, meaning that the U.S. imports more petroleum than it exports. The largest petroleum trade deficit was in 2008, when the U.S. imported $449.8 billion and exported only $61.6 billion.
Petroleum Trade Balance, 1970-2010
Image

Image
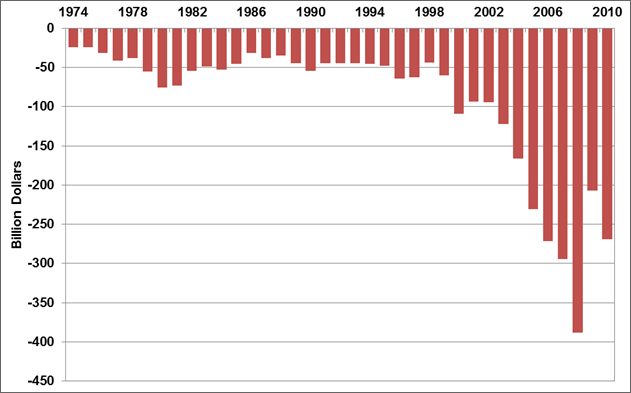
Note: Trade balance = exports minus imports. Includes crude oil, petroleum preparations, liquefied propane and butane, and other mineral fuels.
Supporting Information
| Year Route | Petroleum Exports | Petroleum Imports | Petroleum Balance |
|---|---|---|---|
| (Billion Dollars) | |||
| 1974 | 0.792 | 24.668 | -23.876 |
| 1975 | 0.907 | 25.197 | -24.289 |
| 1976 | 0.998 | 32.226 | -31.228 |
| 1977 | 1.276 | 42.368 | -41.093 |
| 1978 | 1.561 | 39.526 | -37.965 |
| 1979 | 1.914 | 56.715 | -54.801 |
| 1980 | 2.833 | 78.637 | -75.803 |
| 1981 | 3.696 | 76.659 | -72.963 |
| 1982 | 5.947 | 60.458 | -54.511 |
| 1983 | 4.557 | 53.217 | -48.659 |
| 1984 | 4.470 | 56.924 | -52.454 |
| 1985 | 4.707 | 50.475 | -45.768 |
| 1986 | 3.640 | 35.142 | -31.503 |
| 1987 | 3.922 | 42.285 | -38.363 |
| 1988 | 3.693 | 38.787 | -35.094 |
| 1989 | 5.021 | 49.704 | -44.683 |
| 1990 | 6.901 | 61.583 | -54.682 |
| 1991 | 6.954 | 51.350 | -44.396 |
| 1992 | 6.412 | 51.217 | -44.805 |
| 1993 | 6.215 | 51.046 | -44.831 |
| 1994 | 5.659 | 50.835 | -45.176 |
| 1995 | 6.321 | 54.368 | -48.047 |
| 1996 | 7.984 | 72.022 | -64.038 |
| 1997 | 8.592 | 71.152 | -62.560 |
| 1998 | 6.574 | 50.264 | -43.690 |
| 1999 | 7.118 | 67.173 | -60.055 |
| 2000 | 10.192 | 119.251 | -109.059 |
| 2001 | 8.868 | 102.747 | -93.879 |
| 2002 | 8.569 | 102.663 | -94.094 |
| 2003 | 10.209 | 132.433 | -122.224 |
| 2004 | 13.130 | 179.266 | -166.136 |
| 2005 | 19.155 | 250.068 | -230.913 |
| 2006 | 28.171 | 299.714 | -271.543 |
| 2007 | 33.293 | 327.620 | -294.327 |
| 2008 | 61.695 | 449.847 | -388.152 |
| 2009 | 44.509 | 251.833 | -207.324 |
| 2010 | 64.540 | 333.354 | -268.814 |
Source: U.S. Department of Energy, Energy Information Administration, Monthly Energy Review, Table 1.5. | |||