
The density of the population in the U.S., measured as the number of people per square mile, affects the way goods and people are transported. The newly released 2010 Census data show that, on a state by state basis, the District of Columbia has the most dense population, followed by New Jersey and Rhode Island. In the western states, the population is generally less dense, with the exceptions being California, Hawaii, and Washington. Every state except Michigan experienced increased population density from the 2000 Census to the 2010 Census.
U.S. Population Density by State, 2010 (people per square mile)
Image
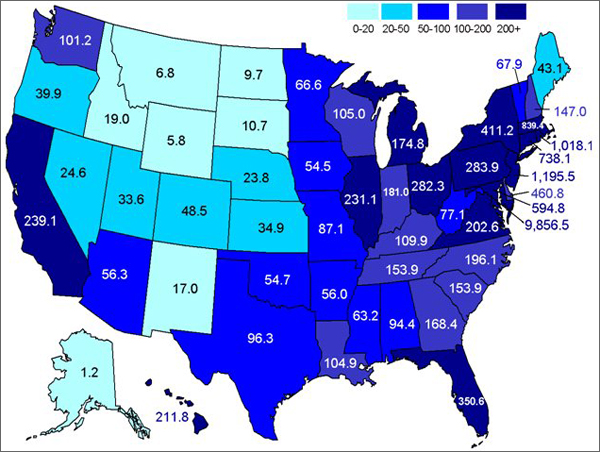
Note: Puerto Rico, a U.S. territory, was excluded from this analysis.
Supporting Information
| State | Population | Population Density (People per Square Mile) |
Population Density Rank |
|---|---|---|---|
| District of Columbia | 601,723 | 9,856.5 | 1 |
| New Jersey | 8,791,894 | 1,195.5 | 2 |
| Rhode Island | 1,052,567 | 1,018.1 | 3 |
| Massachusetts | 6,547,629 | 839.4 | 4 |
| Connecticut | 3,574,097 | 738.1 | 5 |
| Maryland | 5,773,552 | 594.8 | 6 |
| Delaware | 897,934 | 460.8 | 7 |
| New York | 19,378,102 | 411.2 | 8 |
| Florida | 18,801,310 | 350.6 | 9 |
| Pennsylvania | 12,702,379 | 283.9 | 10 |
| Ohio | 11,536,504 | 282.3 | 11 |
| California | 37,253,956 | 239.1 | 12 |
| Illinois | 12,830,632 | 231.1 | 13 |
| Hawaii | 1,360,301 | 211.8 | 14 |
| Virginia | 8,001,024 | 202.6 | 15 |
| North Carolina | 9,535,483 | 196.1 | 16 |
| Indiana | 6,483,802 | 181.0 | 17 |
| Michigan | 9,883,640 | 174.8 | 18 |
| Georgia | 9,687,653 | 168.4 | 19 |
| Tennessee | 6,346,105 | 153.9 | 20 |
| South Carolina | 4,625,364 | 153.9 | 21 |
| New Hampshire | 1,316,470 | 147.0 | 22 |
| Kentucky | 4,339,367 | 109.9 | 23 |
| Wisconsin | 5,686,986 | 105.0 | 24 |
| Louisiana | 4,533,372 | 104.9 | 25 |
| Washington | 6,724,540 | 101.2 | 26 |
| Texas | 25,145,561 | 96.3 | 27 |
| Alabama | 4,779,736 | 94.4 | 28 |
| Missouri | 5,988,927 | 87.1 | 29 |
| West Virginia | 1,852,994 | 77.1 | 30 |
| Vermont | 625,741 | 67.9 | 31 |
| Minnesota | 5,303,925 | 66.6 | 32 |
| Mississippi | 2,967,297 | 63.2 | 33 |
| Arizona | 6,392,017 | 56.3 | 34 |
| Arkansas | 2,915,918 | 56.0 | 35 |
| Oklahoma | 3,751,351 | 54.7 | 36 |
| Iowa | 3,046,355 | 54.5 | 37 |
| Colorado | 5,029,196 | 48.5 | 38 |
| Maine | 1,328,361 | 43.1 | 39 |
| Oregon | 3,831,074 | 39.9 | 40 |
| Kansas | 2,853,118 | 34.9 | 41 |
| Utah | 2,763,885 | 33.6 | 42 |
| Nevada | 2,700,551 | 24.6 | 43 |
| Nebraska | 1,826,341 | 23.8 | 44 |
| Idaho | 1,567,582 | 19.0 | 45 |
| New Mexico | 2,059,179 | 17.0 | 46 |
| South Dakota | 814,180 | 10.7 | 47 |
| North Dakota | 672,591 | 9.7 | 48 |
| Montana | 989,415 | 6.8 | 49 |
| Wyoming | 563,626 | 5.8 | 50 |
| Alaska | 710,231 | 1.2 | 51 |
| United States | 308,745,538 | 87.4 | |
|
Note: Puerto Rico, a U.S. territory, was excluded from this analysis. |