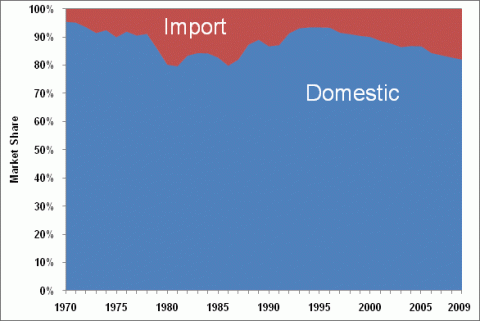
The market share for import cars and light trucks has been growing nearly every year since the mid-1990's. Import car market share more than doubled in that time -- from 14.9% in 1996 to 33.7% in 2009. Imports cars have a larger share of the market than import trucks, but import truck market share has nearly tripled since the mid-1990's. Import truck market share rose from 6.5% in 1994 to 17.9% in 2009.
Cars: Domestic vs. Import Market Share
Light Trucks: Domestic vs. Import Market Share
Supporting Information
| Cars (Thousands) | Light Trucks (Thousands) | |||||
|---|---|---|---|---|---|---|
| Year | Domestic | Import | Percent Import | Domestic | Import | Percent Import |
| 1970 | 7,119 | 1,280 | 15.2% | 1,397 | 66 | 4.5% |
| 1971 | 8,681 | 1,561 | 15.2% | 1,673 | 84 | 4.8% |
| 1972 | 9,327 | 1,614 | 14.8% | 2,096 | 143 | 6.4% |
| 1973 | 9,676 | 1,748 | 15.3% | 2,512 | 233 | 8.5% |
| 1974 | 7,454 | 1,399 | 15.8% | 2,163 | 175 | 7.5% |
| 1975 | 7,053 | 1,571 | 18.2% | 2,053 | 228 | 10.0% |
| 1976 | 8,611 | 1,499 | 14.8% | 2,720 | 236 | 8.0% |
| 1977 | 9,109 | 2,074 | 18.5% | 3,108 | 322 | 9.4% |
| 1978 | 9,312 | 2,002 | 17.7% | 3,473 | 335 | 8.8% |
| 1979 | 8,341 | 2,332 | 21.8% | 2,844 | 467 | 14.1% |
| 1980 | 6,580 | 2,369 | 26.5% | 1,959 | 481 | 19.7% |
| 1981 | 6,181 | 2,308 | 27.2% | 1,745 | 444 | 20.3% |
| 1982 | 5,757 | 2,200 | 27.6% | 2,062 | 408 | 16.5% |
| 1983 | 6,795 | 2,353 | 25.7% | 2,518 | 466 | 15.6% |
| 1984 | 7,952 | 2,372 | 23.0% | 3,257 | 606 | 15.7% |
| 1985 | 8,205 | 2,775 | 25.3% | 3,691 | 767 | 17.2% |
| 1986 | 8,215 | 3,189 | 28.0% | 3,671 | 923 | 20.1% |
| 1987 | 7,085 | 3,107 | 30.5% | 3,785 | 825 | 17.9% |
| 1988 | 7,543 | 3,004 | 28.5% | 4,195 | 605 | 12.6% |
| 1989 | 7,098 | 2,680 | 27.4% | 4,108 | 502 | 10.9% |
| 1990 | 6,919 | 2,384 | 25.6% | 3,948 | 600 | 13.2% |
| 1991 | 6,162 | 2,028 | 24.8% | 3,595 | 528 | 12.8% |
| 1992 | 6,286 | 1,927 | 23.5% | 4,231 | 398 | 8.6% |
| 1993 | 6,742 | 1,776 | 20.8% | 4,987 | 364 | 6.8% |
| 1994 | 7,255 | 1,735 | 19.3% | 5,641 | 392 | 6.5% |
| 1995 | 7,129 | 1,506 | 17.4% | 5,660 | 393 | 6.5% |
| 1996 | 7,255 | 1,271 | 14.9% | 6,089 | 430 | 6.6% |
| 1997 | 6,917 | 1,355 | 16.4% | 6,226 | 571 | 8.4% |
| 1998 | 6,762 | 1,380 | 16.9% | 6,649 | 650 | 8.9% |
| 1999 | 6,979 | 1,719 | 19.8% | 7,306 | 767 | 9.5% |
| 2000 | 6,831 | 2,016 | 22.8% | 7,557 | 830 | 9.9% |
| 2001 | 6,325 | 2,098 | 24.9% | 7,717 | 983 | 11.3% |
| 2002 | 5,878 | 2,226 | 27.5% | 7,650 | 1,063 | 12.2% |
| 2003 | 5,527 | 2,083 | 27.4% | 7,731 | 1,207 | 13.5% |
| 2004 | 5,396 | 2,149 | 28.5% | 8,135 | 1,226 | 13.1% |
| 2005 | 5,533 | 2,187 | 28.3% | 8,056 | 1,225 | 13.2% |
| 2006 | 5,476 | 2,345 | 30.0% | 7,329 | 1,355 | 15.6% |
| 2007 | 5,253 | 2,365 | 31.0% | 7,082 | 1,389 | 16.4% |
| 2008 | 4,535 | 2,278 | 33.4% | 5,283 | 1,098 | 17.2% |
| 2009 | 3,619 | 1,837 | 33.7% | 4,060 | 885 | 17.9% |
Note: Domestic includes all vehicles built in North America. Imports are units imported from outside North America. | ||||||


