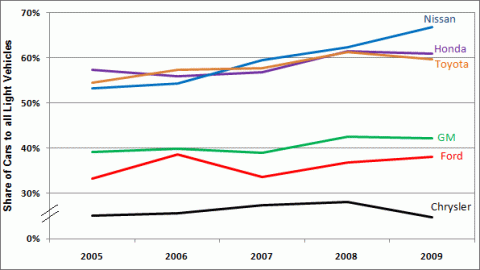
From 2005 to 2009 light vehicle sales have gradually shifted toward cars over light trucks. The graph below shows this trend broken down by the major manufacturers. This trend is more evident among the major import brands than the domestic brands.
Share of Car Sales by Selected Manufacturer
Supporting Information
| 2005 | 2006 | 2007 | 2008 | 2009 | |
|---|---|---|---|---|---|
| Chrysler | 25.1% | 25.7% | 27.4% | 28.1% | 24.7% |
| Ford | 33.3% | 38.6% | 33.6% | 36.9% | 38.1% |
| GM | 39.1% | 39.9% | 38.9% | 42.5% | 42.2% |
| Honda | 57.3% | 55.9% | 56.9% | 61.4% | 60.8% |
| Nissan | 53.2% | 54.3% | 59.5% | 62.4% | 66.8% |
| Toyota | 54.5% | 57.4% | 57.8% | 61.2% | 59.6% |
| Source: WardsAuto InfoBank. | |||||


