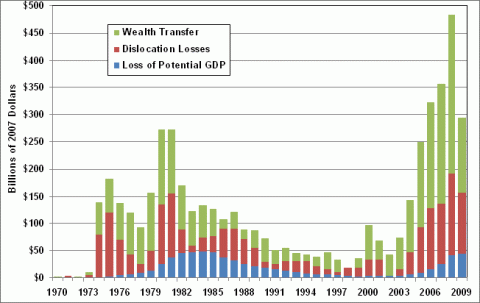
The United States has long recognized the problem of oil dependence and the economic problems that arise from it. According to Oak Ridge National Laboratory (ORNL) researchers Greene and Hopson, oil dependence is a combination of four factors: (1) a noncompetitive world oil market strongly influenced by the OPEC cartel, (2) high levels of U.S. imports, (3) the importance of oil to the U.S. economy, and (4) the lack of economical and readily available substitutes for oil. ORNL developed a model to estimate the historical cost of oil dependence and analyze the potential effectiveness of policies on likely future costs. The most recent study using this model shows that the U.S. economy suffered the greatest losses in 2008 when wealth transfer and GDP losses (combined) amounted to approximately half a trillion dollars. However, when comparing oil dependence to the size of the economy, the year 1980 is the highest. Oil dependence costs were almost 4.5% of GDP in 1980, but were under 3.5% in 2008.
Costs of Oil Dependence to the U.S. Economy, 1970-2009
Wealth Transfer is the product of total U.S. oil imports and the difference between the actual market price of oil (influenced by market power) and what the price would have been in a competitive market.
Dislocation Losses are temporary reductions in GDP as a result of oil price shocks.
Loss of Potential Gross Domestic Product (GDP) results because a basic resource used by the economy to produce output has become more expensive. As a consequence, with the same endowment of labor, capital, and other resources, our economy cannot produce quite as much as it could have at a lower oil price.
Supporting Information
| Year | Loss of Potential GDP | Dislocation Losses | Wealth Transfer | ||
|---|---|---|---|---|---|
| 1970 | $0 | $2 | $1 | ||
| 1971 | $0 | $4 | $1 | ||
| 1972 | $0 | $2 | $2 | ||
| 1973 | $0 | $6 | $5 | ||
| 1974 | $1 | $79 | $60 | ||
| 1975 | $3 | $118 | $63 | ||
| 1976 | $5 | $65 | $68 | ||
| 1977 | $8 | $36 | $76 | ||
| 1978 | $9 | $15 | $69 | ||
| 1979 | $14 | $36 | $107 | ||
| 1980 | $26 | $110 | $137 | ||
| 1981 | $38 | $118 | $117 | ||
| 1982 | $45 | $43 | $81 | ||
| 1983 | $48 | $12 | $63 | ||
| 1984 | $49 | $25 | $60 | ||
| 1985 | $48 | $29 | $51 | ||
| 1986 | $37 | $54 | $16 | ||
| 1987 | $32 | $59 | $31 | ||
| 1988 | $25 | $46 | $18 | ||
| 1989 | $21 | $35 | $32 | ||
| 1990 | $20 | $10 | $43 | ||
| 1991 | $17 | $9 | $26 | ||
| 1992 | $14 | $17 | $24 | ||
| 1993 | $11 | $19 | $16 | ||
| 1994 | $9 | $21 | $13 | ||
| 1995 | $7 | $14 | $18 | ||
| 1996 | $7 | $9 | $32 | ||
| 1997 | $6 | $6 | $22 | ||
| 1998 | $4 | $16 | ($6) | ||
| 1999 | $3 | $16 | $16 | ||
| 2000 | $4 | $30 | $63 | ||
| 2001 | $4 | $30 | $34 | ||
| 2002 | $4 | $0 | $40 | ||
| 2003 | $5 | $12 | $57 | ||
| 2004 | $6 | $41 | $97 | ||
| 2005 | $10 | $83 | $157 | ||
| 2006 | $16 | $111 | $194 | ||
| 2007 | $25 | $112 | $220 | ||
| 2008 | $42 | $149 | $293 | ||
| 2009 | $45 | $111 | $138 | ||
Source: Greene, David L., and Janet L. Hopson, "The Costs of Oil Dependence 2009," Oak Ridge National Laboratory Memorandum, 2010. Related published material on oil dependence can also be found on the Oak Ridge National Laboratory, Center for Transportation Analysis Web site, Costs of Oil Dependence: A 2000 Update. | |||||


