
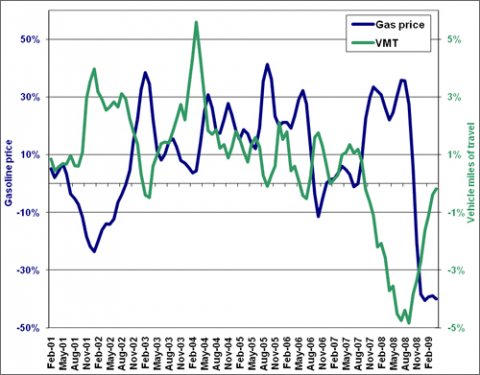
The price of gasoline is one factor that can have an effect on the number of highway vehicle miles traveled (VMT). The graph below shows a three-month moving average of the percentage change of monthly data from one year to the next (i.e., February 2001 data were compared with February 2000 data).
Vehicle Travel and Gasoline Price (Three-month Moving Average of the Percent Change from Previous Year's Monthly Total and Average)
Image
Image

Supporting Information
| 3-month moving average | ||
|---|---|---|
| Month-Year | Gas Price | Vehicle Travel |
| Feb-01 | 5.1% | 0.9% |
| Mar-01 | 2.1% | 0.4% |
| Apr-01 | 4.4% | 0.6% |
| May-01 | 6.9% | 0.7% |
| Jun-01 | 3.3% | 0.7% |
| Jul-01 | -3.7% | 1.0% |
| Aug-01 | -5.2% | 0.6% |
| Sep-01 | -7.1% | 0.6% |
| Oct-01 | -11.5% | 1.1% |
| Nov-01 | -18.5% | 3.0% |
| Dec-01 | -21.8% | 3.5% |
| Jan-02 | -23.5% | 4.0% |
| Feb-02 | -20.2% | 3.2% |
| Mar-02 | -16.0% | 2.9% |
| Apr-02 | -14.0% | 2.5% |
| May-02 | -14.1% | 2.6% |
| Jun-02 | -12.3% | 2.8% |
| Jul-02 | -6.5% | 2.7% |
| Aug-02 | -4.0% | 3.1% |
| Sep-02 | -0.3% | 2.9% |
| Oct-02 | 4.6% | 2.2% |
| Nov-02 | 14.8% | 1.8% |
| Dec-02 | 22.4% | 1.4% |
| Jan-03 | 32.6% | 0.3% |
| Feb-03 | 38.5% | -0.4% |
| Mar-03 | 34.7% | -0.5% |
| Apr-03 | 22.4% | 0.6% |
| May-03 | 11.4% | 1.0% |
| Jun-03 | 8.1% | 1.4% |
| Jul-03 | 10.1% | 1.4% |
| Oct-05 | 36.2% | 0.3% |
| Nov-05 | 23.3% | 0.6% |
| Dec-05 | 19.9% | 2.1% |
| Jan-06 | 21.2% | 1.5% |
| Feb-06 | 21.2% | 1.8% |
| Mar-06 | 19.2% | 0.4% |
| Apr-06 | 23.3% | 0.6% |
| May-06 | 29.3% | 0.1% |
| Jun-06 | 32.2% | -0.4% |
| Jul-06 | 27.6% | -0.5% |
| Aug-06 | 12.4% | 0.2% |
| Sep-06 | -3.6% | 1.6% |
| Oct-06 | -11.4% | 1.8% |
| Nov-06 | -5.3% | 1.3% |
| Dec-06 | 0.2% | 0.6% |
| Jan-07 | 1.3% | 0.0% |
| Feb-07 | 1.7% | 0.1% |
| Mar-07 | 3.5% | 0.3% |
| Apr-07 | 6.0% | 1.0% |
| May-07 | 4.9% | 1.1% |
| Jun-07 | 3.2% | 1.4% |
| Jul-07 | -1.1% | 1.0% |
| Aug-07 | -0.1% | 1.2% |
| Sep-07 | 8.0% | 0.8% |
| Oct-07 | 22.5% | -0.2% |
| Nov-07 | 29.8% | -0.6% |
| Dec-07 | 33.4% | -1.1% |
| Jan-08 | 32.0% | -2.2% |
| Feb-08 | 30.8% | -2.1% |
| Mar-08 | 26.2% | -2.6% |
| Apr-08 | 22.1% | -3.7% |
| May-08 | 24.6% | -3.6% |
| Jun-08 | 30.5% | -4.5% |
| Jul-08 | 35.8% | -4.7% |
| Aug-08 | 35.6% | -4.4% |
| Sep-08 | 27.4% | -4.8% |
| Oct-08 | 5.4% | -3.8% |
| Nov-08 | -20.1% | -3.4% |
| Dec-08 | -38.4% | -2.7% |
| Jan-09 | -40.6% | -1.6% |
| Feb-09 | -39.3% | -1.1% |
| Mar-09 | -39.0% | -0.4% |
| Apr-09 | -40.1% | -0.2% |
Source: VMT: U.S. Department of Transportation, Office of Highway Policy Information, Traffic Volume Trends, Table 1. | ||