
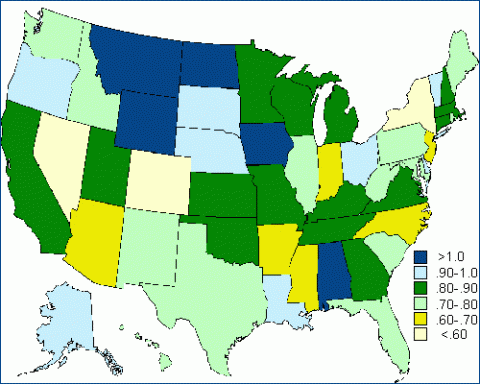
The number of vehicles per capita by state varies considerably, however, that variation among states does not hold to any clearly defined geographic regions or patterns. Wyoming has the highest number of vehicles per capita (1.14) while neighboring Colorado has the lowest (0.34). The number of vehicles per capita for the entire United States is 0.78 vehicles per capita.
Vehicles per Capita by State, 2007
Image
Image
Supporting Information
| State | Light Vehicles per Capita |
|---|---|
| Wyoming | 1.14 |
| Montana | 1.12 |
| North Dakota | 1.08 |
| Iowa | 1.05 |
| Alabama | 1.03 |
| Nebraska | 1.00 |
| Alaska | 0.96 |
| Delaware | 0.95 |
| South Dakota | 0.95 |
| Ohio | 0.91 |
| Vermont | 0.91 |
| Louisiana | 0.91 |
| Minnesota | 0.87 |
| Utah | 0.87 |
| Michigan | 0.87 |
| Washington | 0.87 |
| Oklahoma | 0.86 |
| Wisconsin | 0.86 |
| Connecticut | 0.86 |
| Kentucky | 0.84 |
| Tennessee | 0.84 |
| Virginia | 0.84 |
| California | 0.84 |
| Kansas | 0.83 |
| New Hampshire | 0.83 |
| Missouri | 0.83 |
| Georgia | 0.82 |
| Massachusetts | 0.82 |
| Maryland | 0.79 |
| Idaho | 0.79 |
| Maine | 0.78 |
| Oregon | 0.77 |
| South Carolina | 0.77 |
| New Mexico | 0.77 |
| Pennsylvania | 0.76 |
| Hawaii | 0.76 |
| West Virginia | 0.75 |
| Illinois | 0.75 |
| Rhode Island | 0.73 |
| Texas | 0.72 |
| Florida | 0.71 |
| Arkansas | 0.70 |
| New Jersey | 0.69 |
| Mississippi | 0.68 |
| North Carolina | 0.67 |
| Arizona | 0.66 |
| Indiana | 0.61 |
| New York | 0.57 |
| Nevada | 0.50 |
| Dist. of Columbia | 0.35 |
| Colorado | 0.34 |
| U.S. Total | 0.78 |
Source: Licensed drivers – U.S. Department of Transportation, Federal Highway Administration, Highway Statistics 2007, Tables MV-1, MV-9, and PS-1. | |