
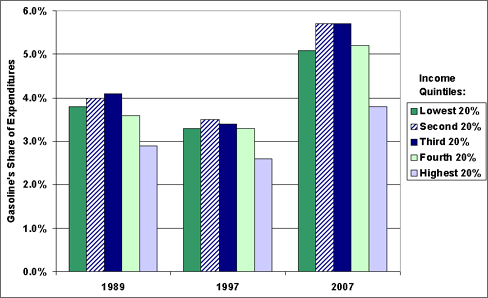
In the annual Consumer Expenditure Survey, household incomes are grouped into five equal parts called quintiles (each quintile is 20%). Households in the second and third quintiles consistently have a higher share of spending on gasoline each year than households in the other quintiles.
Household Gasoline Expenditures by Income Quintile
Image

Image
Supporting Information
| Income Quintile | 1989 | 1997 | 2007 |
|---|---|---|---|
| Share of Expenditures | |||
| Lowest 20% | 3.8% | 3.3% | 5.1% |
| Second 20% | 4.0% | 3.5% | 5.7% |
| Third 20% | 4.1% | 3.4% | 5.7% |
| Fourth 20% | 3.6% | 3.3% | 5.2% |
| Highest 20% | 2.9% | 2.6% | 3.8% |
| All | 3.5% | 3.1% | 4.8% |
Source: Bureau of Labor Statistics, Consumer Expenditure Survey | |||