
An analysis of Chicago-area ride hailing data shows that those in census tracts with higher-income households and fewer household vehicles more commonly used Transportation Network Companies (TNCs) like Uber and Lyft.
October 17, 2022An analysis of Chicago-area ride hailing data shows that those in census tracts with higher-income households and fewer household vehicles more commonly used Transportation Network Companies (TNCs) like Uber and Lyft. Chicago-area census tracts were classified by average annual household income and average number of vehicles owned. In census tracts with household income less than $35,000, nearly all had an average of less than 100 annual TNC trips per capita. In census tracts with household income between $35,000 and $75,000, nearly all had an average of less than 200 annual TNC trips per capita. In census tracts with household income over $75,000, there was great variation in the average number of TNC trips, with one tract averaging 1,025 annual trips per capita.
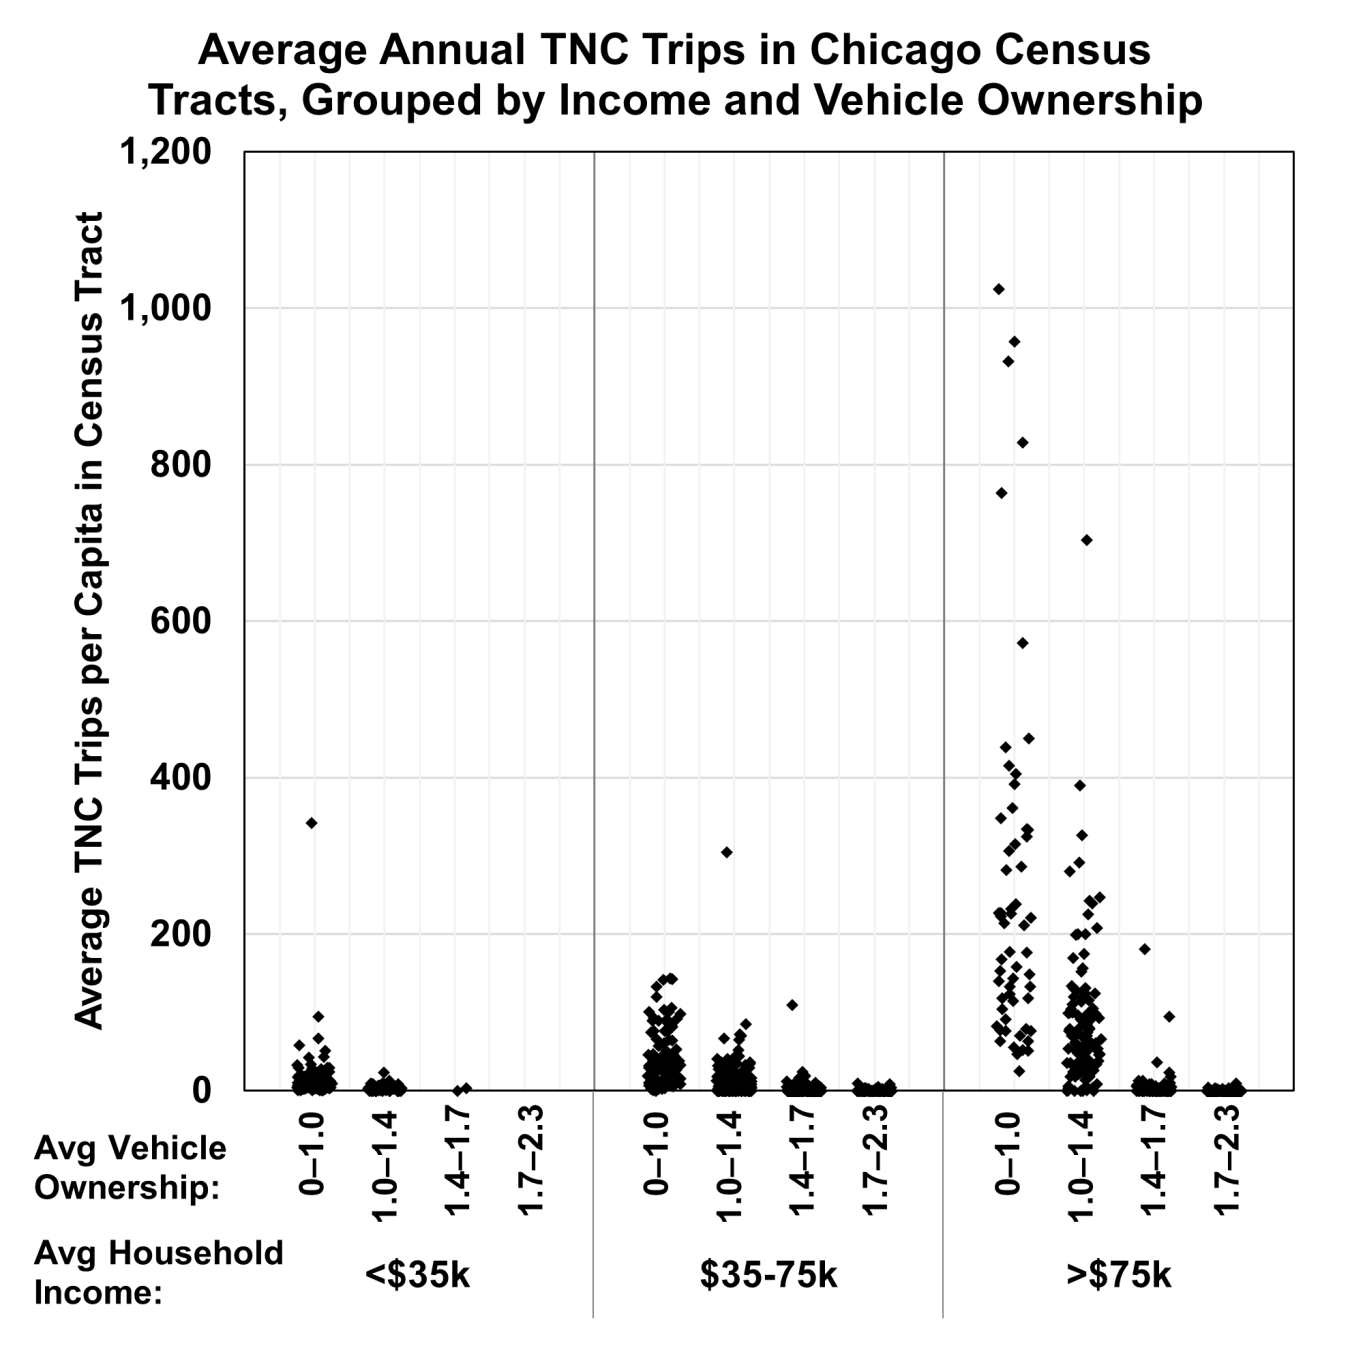
Note: Each dot represents one census tract in the Chicago area. Trips were classified into census tracts based on the location where the trip began. This dataset contains trip-level data for all TNC trips in Chicago between November 2018 and December 2021.
Source: Argonne National Laboratory, Shared Mobility Data Availability and Usage Trends, ANL/ESD-22/9, May 2022.