
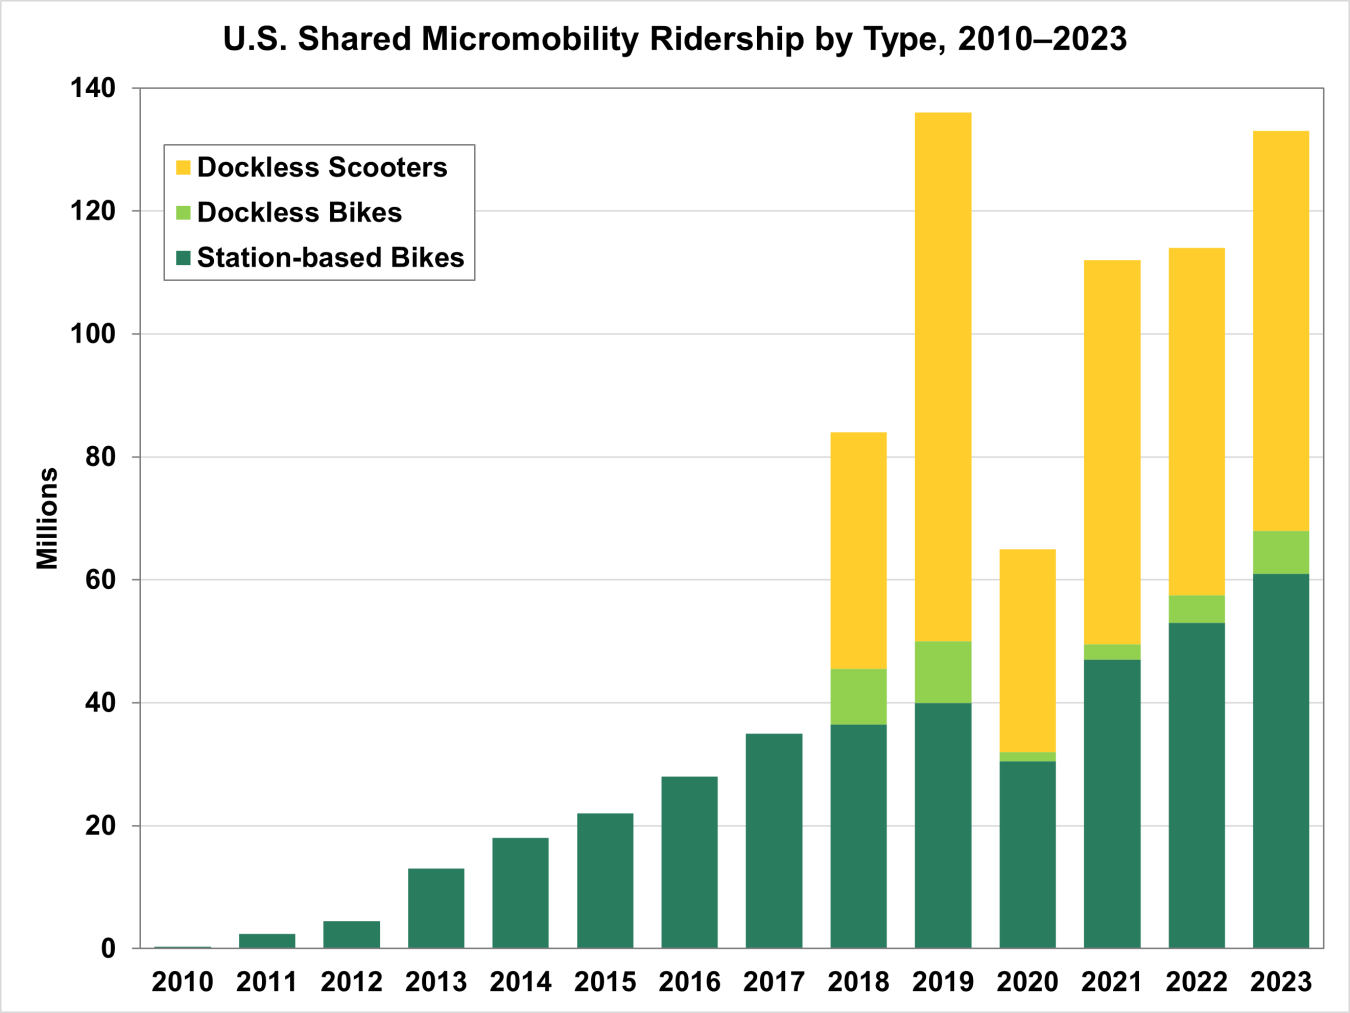
In 2023, there were 133 million shared micromobility trips taken with ridership almost evenly split between scooters with 65 million trips, and bikes totaling 68 million trips.
October 28, 2024In 2023, there were 133 million shared micromobility trips taken with ridership almost evenly split between scooters with 65 million trips, and bikes totaling 68 million trips. Data for scooters was not available until 2018 although the first scooter systems began in 2017. By 2023, scooter ridership makes up about as many rides as station-based bikeshare ridership . All scooter trips in these data are dockless, but most shared bike trips are station-based where bikes must be picked up and returned to designated stations. Overall, micromobility use is growing and helping to reduce emissions and traffic.
Note: Collected from shared micromobility operators and from cities.
Source: National Association of City Transportation Officials (NACTO), North American Shared Micromobility in the U.S. and Canada: 2023, July 2024.