
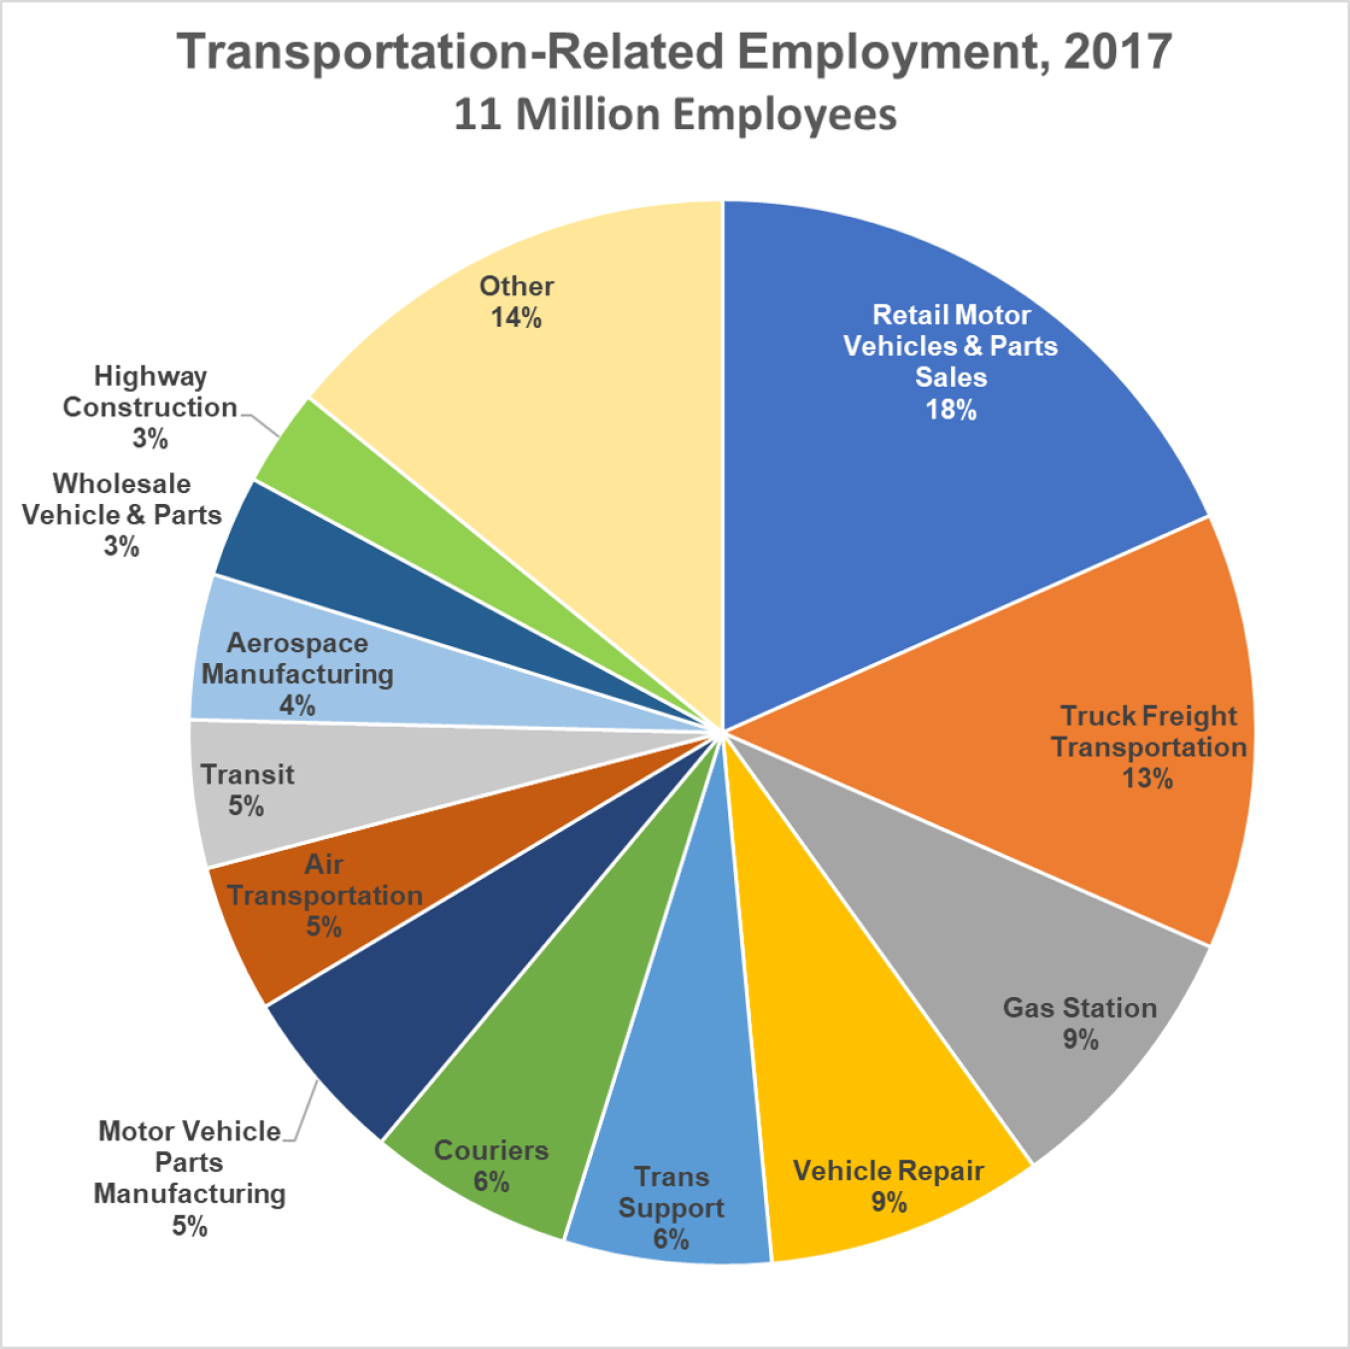
In 2017 there were 25 transportation-related employment categories with combined employment of about 11 million, which is 7.5% of total employment.
March 5, 2018In 2017 there were 25 transportation-related employment categories with combined employment of about 11 million, which is 7.5% of total employment. Retail motor vehicles and parts sales employment made up the largest share (18%), with truck freight transportation (including drivers) second with 13%.
Notes:
- "Other" category includes: Travel arrangement and reservation services, Rail transportation, Automotive equipment rental and leasing, Auto & light truck manufacturing, Motor vehicle body & trailer manufacturing, Oil & gas pipeline construction, Ship & boat building, Water transportation, Railroad rolling stock & other transportation equipment manufacturing, Tire manufacturing, Pipeline transportation, Scenic & sightseeing, and Heavy-duty truck manufacturing. Each of these categories represented less than 3% of transportation-related employment.
- Employment is the total number of persons on establishment payrolls employed full- or part-time who received pay (whether they worked or not) for any part of the pay period that includes the 12th day of the month.
- The employment shown is not seasonally-adjusted.
Source: U.S. Bureau of Labor Statistics, Current Employment Statistics, website query, February 21, 2018.
Supporting Information:
Transportation-related Employment, 2017
| Employment Category | Employment (Thousands) | Share |
|---|---|---|
| Motor vehicle and parts dealers - retail | 2,008.3 | 18.3% |
| Truck transportation (includes drivers) | 1,453.5 | 13.3% |
| Gasoline stations - retail | 931.5 | 8.5% |
| Automotive repair and maintenance | 923.4 | 8.4% |
| Support activities for transportation | 690.1 | 6.3% |
| Couriers and messengers | 682.8 | 6.2% |
| Motor vehicle parts manufacturing | 586.3 | 5.4% |
| Air transportation | 492.7 | 4.5% |
| Transit & ground transportation | 491.5 | 4.5% |
| Aerospace products and parts manufacturing | 484.6 | 4.4% |
| Motor vehicles and parts - wholesale | 337.5 | 3.1% |
| Highway street and bridge construction | 324.7 | 3.0% |
| Other | 1,550.3 | 14.2% |
| - Travel arrangement and reservation services | 217.6 | 2.0% |
| - Rail transportation | 215.0 | 2.0% |
| - Automotive equipment rental and leasing | 214.4 | 2.0% |
| - Auto and light truck manufacturing | 182.9 | 1.7% |
| - Motor vehicle body and trailer manufacturing | 154.2 | 1.4% |
| - Oil and gas pipeline construction | 137.3 | 1.3% |
| - Ship & boat building | 136.7 | 1.2% |
| - Water transportation | 65.2 | 0.6% |
| - Railroad rolling stock & other transportation equipment mfg. | 57.9 | 0.5% |
| - Tire manufacturing | 56.1 | 0.5% |
| - Pipeline transportation | 48.3 | 0.4% |
| - Scenic & sightseeing | 35.6 | 0.3% |
| - Heavy-duty truck manufacturing | 29.1 | 0.3% |
| Total transportation-related employment | 10,957.2 | 100.0% |