
Wind turbines need to protect themselves just as communities do during severe weather events and storms. Find out how wind turbines survive severe storms, like hurricanes and tornadoes, and how you can stay safe.
Office of Energy Efficiency & Renewable Energy
July 17, 2024Extreme weather events, such as tornadoes and hurricanes, are presenting communities and infrastructure across the nation with increasingly frequent and severe challenges. According to the National Oceanic and Atmospheric Administration (NOAA), approximately 1,200 tornadoes occur yearly in the United States alone.
However, not all extreme weather events like tornadoes are the same. In the United States, 80% of tornadoes reported are “weak,” with wind speeds up to 115 miles per hour (mph). “Violent” tornadoes, with wind speeds over 200 mph, account for less than 1% of all tornado reports.
Risks from extreme weather are increasing as temperatures rise due to global climate change. Deploying renewable energy resources like wind turbines is a way to mitigate the impacts of global climate change and lessen the impacts of extreme weather in the future. But you may be wondering how energy infrastructure, such as wind turbines themselves, behave in extreme weather like tornadoes, hurricanes, and other storms with high winds.
Siting and Design
Although wind turbines are designed with contingencies for extreme weather just like any other piece of infrastructure, including buildings, they can be damaged by the direct hit of a violent tornado or severe storm. Wind farms are built at a safe distance from populated areas and inhabited dwellings, and they are developed with thoughtful public engagement and thorough assessments of natural land features and hazards, local weather patterns, and historical data to minimize or eliminate negative impacts to wildlife and people. They often are built with safety features, such as emergency access and response routes, to ensure any issues that arise can be addressed quickly.
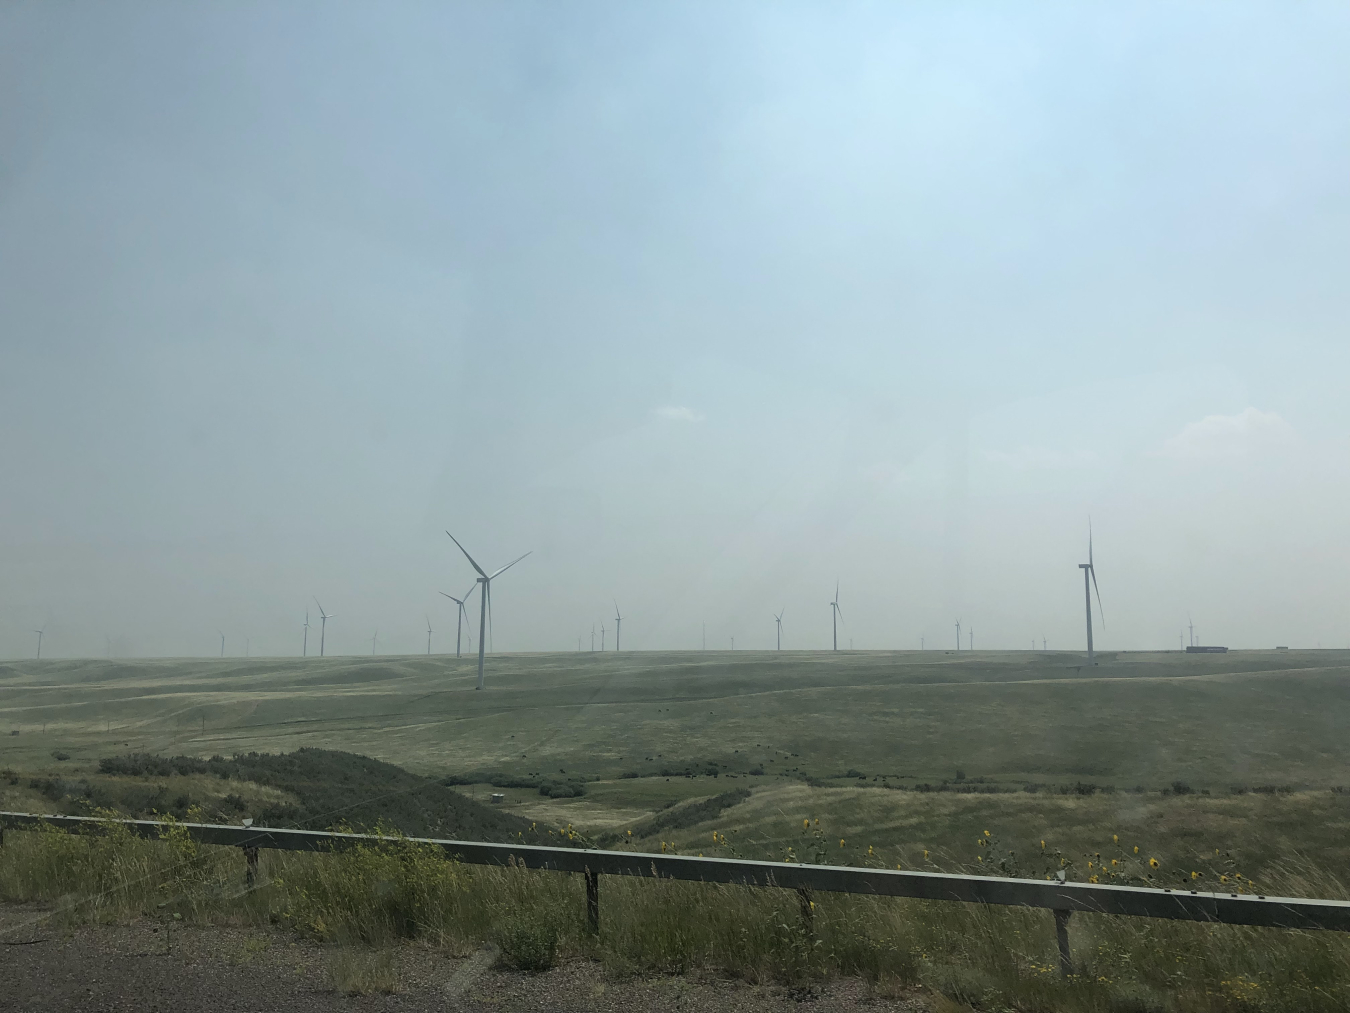
A utility-scale wind farm in the Western United States.
Modern wind farms are reliable, safe, state-of-the-art power plants with well-tested technologies that meet approved standards and hundreds of thousands of hours of operating experience.
The International Electrotechnical Commission (IEC), an international organization that brings together about 170 countries and around 30,000 experts globally, requires most of today’s wind turbines must be built to withstand sustained winds of 112 mph and peak 3-second gusts of 156 mph (known as standard IEC 61400-01). IEC sets standards for developing electrical infrastructure with a goal of increasing the safety of people and the environment around it.
One might expect more wind to be a good thing for wind turbines and their connected energy systems. But beyond a certain threshold, additional wind doesn’t necessarily translate to more power. Wind turbines need to be protected just as communities do during tropical storms, hurricanes, and tornadoes. To better understand how turbines respond to extreme weather events, we will explain their power curve as well as answer some frequently asked questions.
The Power Curve
The diagram below shows the power output of a turbine against steady wind speeds. The cut-in speed (typically between 6 and 9 mph) is when the blades start rotating and generating power. As wind speeds increase, more electricity is generated until it reaches a limit, known as the rated speed. This is the point that the turbine produces its maximum, or rated power. As the wind speed continues to increase, the power generated by the turbine remains constant until it eventually hits a cut-out speed (varies by turbine) and shuts down to prevent unnecessary strain on the rotor.

The power curve.
Measure Wind Speed
Every wind turbine has an anemometer that measures wind speed and a wind vane to keep track of the wind’s direction. See if you can find them toward the end of the scene of this 360° wind turbine tour video.
When the anemometer registers wind speeds higher than 55 mph (cut-out speed varies by turbine), it triggers the wind turbine to automatically shut off. This cut-out speed is much lower than the wind speeds turbines are designed to withstand, but shutting down reduces the risk of damage to the turbine.
Feather the Blades
When wind speeds surpass a modern utility-scale turbine’s rated wind speed, the blades begin to feather, or point into the wind to reduce their surface area. In some instances, although not common, the blades can even be locked down to ride out severe gusts.
Despite this shut off, the yaw drive, located in the wind turbine’s nacelle, continuously points the rotor into the wind, even as weather patterns shift as they pass through.
Monitor and Resume
Once the anemometer measures speeds at or below the turbine’s cut-out speed (in this case 55 mph), the blades unfeather and resume normal operation, providing renewable energy back to the grid—normally within minutes.
Block Island’s First Test
This shut down process was on full display at Rhode Island’s Block Island Wind Farm—America’s first offshore wind farm—when winter storm Stella rolled through in March 2017. All five turbines were operating at full capacity (30 megawatts), except for a brief window of several hours when wind speeds exceeded 55 mph.
Although this was not a hurricane, it does demonstrate the shutdown process. The wind farm sustained wind speeds higher than 70 mph during the automatic shutdown and successfully powered back up to serve Block Island after the winds diminished.
Check out our animation: How a Wind Turbine Works.
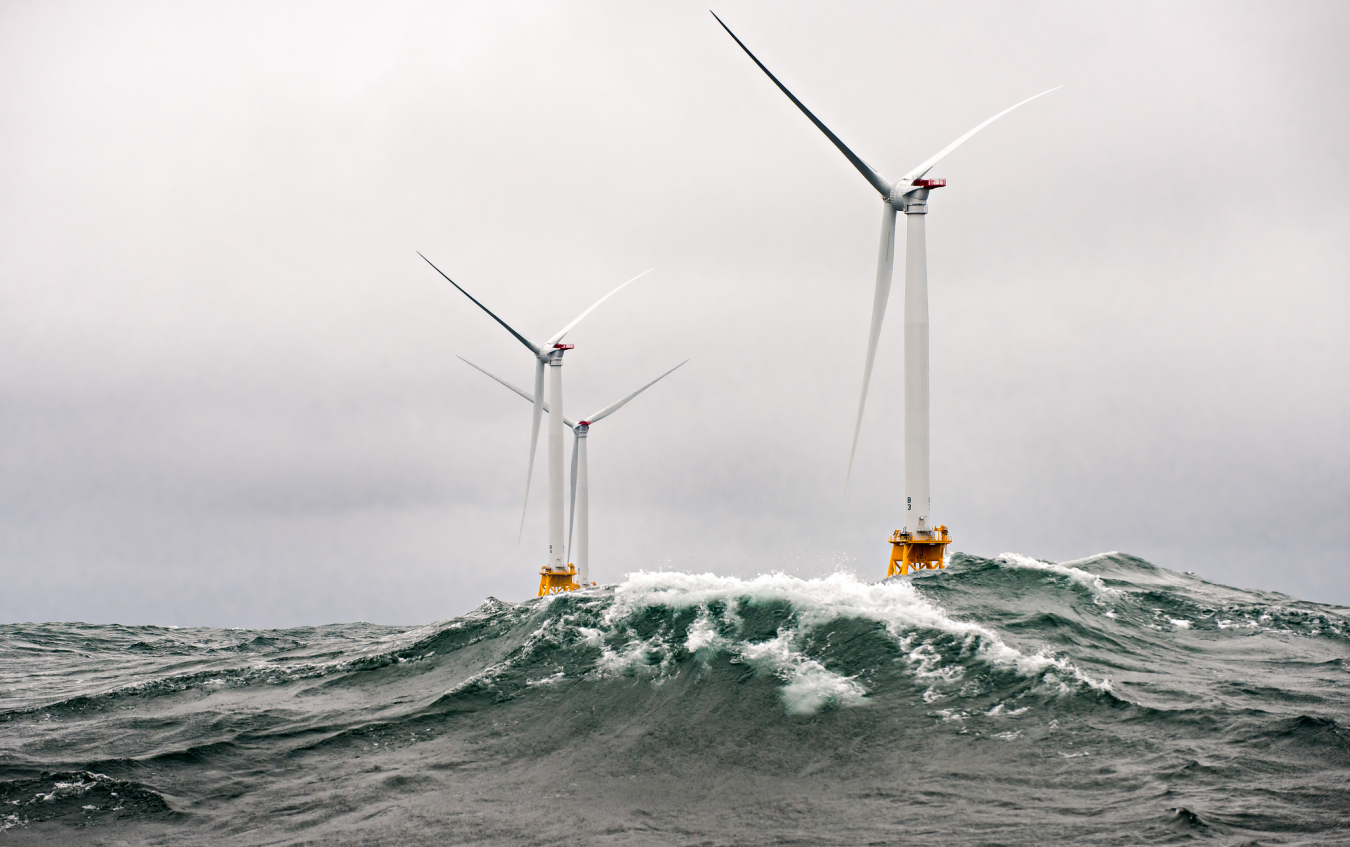
Heavy seas engulf the Block Island Wind Farm- the first US offshore wind farm. The five Halide 6-megawatt turbines were installed by Deepwater Wind and began producing power in 2016.
Stay Safe During Extreme Weather Events
Modern weather observing systems have increased warning times while reducing false alarms. Today, weather forecasters in the United States can usually identify where conditions will be favorable for events like tornado formation and issue a Tornado Watch 1–7 hours in advance (with the average Tornado Warning time 10–15 minutes). Advanced lead times reduce injuries and increase notice for infrastructure owners compared to storms with no warning.
Visit the U.S. Federal Emergency Management Agency’s Preparedness Community website to learn about and explore protective actions you can take to keep your community, your property, and yourself safe from the risks of tornadoes, hurricanes, and other extreme weather events and hazards.
Frequently Asked Questions
Wind turbines are required to be placed a minimum distance from inhabited buildings (known as a setback ordinance) to reduce risk to human safety in the case of a catastrophic event. For additional safety information, see section 2.8 of the Land-Based Wind Energy Siting report.
Although wind turbines are designed to automatically shut off at very high wind speeds, they—like any other piece of infrastructure including buildings—can be damaged by a direct hit of a tornado. One advantage that a renewable energy source like wind has over more centralized power plants (like coal or natural gas) is its distributed nature; if one or several wind turbines are damaged, the other turbines in the wind farm can keep operating and providing power.
The ability to measure and assess available wind resources is crucial to the development, siting, and operation of a wind energy plant. The U.S. Department of Energy’s (DOE) Wind Energy Technologies Office (WETO) supports efforts to accurately define, measure, and forecast the nation's land-based and offshore wind resources.
Researchers collected radar and other meteorological data on a tornado, as well as operational data from a nearby wind farm it passed by in Oklahoma. This work is part of the American WAKE experimENt (AWAKEN) campaign, which is a collaborative effort between DOE national laboratories and U.S. universities, sponsored by WETO. Collection and analysis of AWAKEN data will provide realistic atmospheric conditions that will help engineers better understand how turbines interact with a variety of atmospheric conditions. The AWAKEN data will be used to inform strategies to make turbines and wind farms more efficient and turbines more durable.
WETO leads the Wind Forecast Improvement Projects (WFIP) in partnership with the NOAA to develop more accurate methods for determining wind forecasts. The first phase (WFIP1) used targeted wind observations and advanced forecast models and algorithms to improve wind forecasts in the Upper Great Plains and West Texas. The third phase (WFIP3) is developing a first-of-its kind high-quality resource dataset off the coasts of Massachusetts and Rhode Island to improve wind forecasting for offshore wind.
To learn more about how WETO is developing technology solutions to mitigate severe weather impact on wind turbines, see Wind Turbines in Extreme Weather: Solutions for Hurricane Resiliency.
Wind resource maps provide an estimate of the average wind speed at the hub height of a turbine, which help communities and wind developers choose the most cost-effective siting locations. Wind farms are built at a safe distance from populated areas and inhabited dwellings, and they are developed with thoughtful public engagement and thorough assessments of natural land features and hazards, local weather patterns, and historical data to minimize or eliminate negative impacts to wildlife and people. For more information, see the WINDExchange website, land-based wind siting report, and the DOE renewable energy siting webpage.
Read more on WETO’s Frequently Asked Questions about Wind Energy page.
This blog was originally published in June 2017 and updated in May 2024 and again in July 2024.