
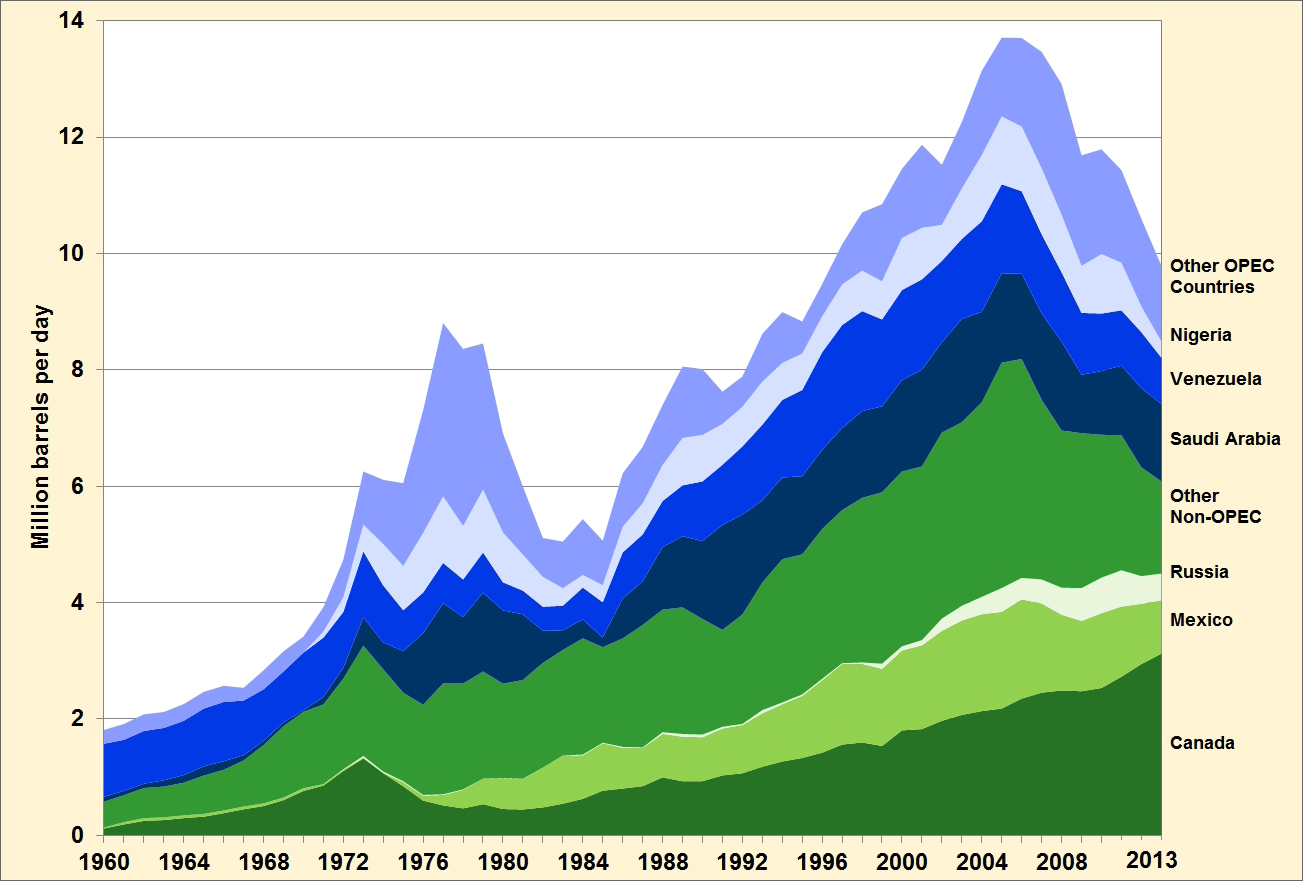
The figure below shows the volume and source of imported petroleum to the United States from 1960 to 2013. The countries which are members of OPEC (Organization of the Petroleum Exporting Countries) are shown in shades of blue while non-OPEC countries are shown in shades of green. Petroleum imports rose sharply from the mid-1960s to 1977 when OPEC countries supplied 70% of all imported petroleum. Petroleum imports then plummeted from the late 1970s through the early 1980s. While petroleum imports rebounded to a peak of nearly 14 million barrels per day in 2005, the share of imports from non-OPEC countries has grown and now accounts for a majority of imported petroleum. In 2013, non-OPEC countries supplied nearly two-thirds of all petroleum imported to the United States. Between 2005 and 2013, overall petroleum imports have declined 28.5%.
U.S. Petroleum Imports by Country, 1960-2013
Image

Supporting Information
| Year | Non-OPEC Countries | OPEC Countries | Total | Percent OPEC | ||||||
| Canada | Mexico | Russia | Other Non-OPEC | Nigeria | Saudi Arabia | Venezuela | Other OPEC Countries | |||
| 1960 | 0.12 | 0.02 | 0.00 | 0.45 | 0.00 | 0.08 | 0.91 | 0.24 | 1.81 | 68% |
| 1961 | 0.19 | 0.04 | 0.00 | 0.46 | 0.00 | 0.07 | 0.88 | 0.27 | 1.92 | 64% |
| 1962 | 0.25 | 0.05 | 0.00 | 0.52 | 0.00 | 0.07 | 0.91 | 0.29 | 2.08 | 61% |
| 1963 | 0.27 | 0.05 | 0.00 | 0.53 | 0.00 | 0.11 | 0.90 | 0.27 | 2.12 | 60% |
| 1964 | 0.30 | 0.05 | 0.00 | 0.56 | 0.00 | 0.13 | 0.93 | 0.29 | 2.26 | 60% |
| 1965 | 0.32 | 0.05 | 0.00 | 0.66 | 0.00 | 0.16 | 0.99 | 0.29 | 2.47 | 58% |
| 1966 | 0.38 | 0.05 | 0.00 | 0.70 | 0.00 | 0.15 | 1.02 | 0.28 | 2.57 | 56% |
| 1967 | 0.45 | 0.05 | 0.00 | 0.79 | 0.00 | 0.09 | 0.94 | 0.22 | 2.54 | 49% |
| 1968 | 0.51 | 0.05 | 0.00 | 1.00 | 0.00 | 0.07 | 0.89 | 0.33 | 2.84 | 45% |
| 1969 | 0.61 | 0.04 | 0.00 | 1.23 | 0.00 | 0.07 | 0.87 | 0.35 | 3.17 | 41% |
| 1970 | 0.77 | 0.04 | 0.00 | 1.31 | 0.00 | 0.03 | 0.99 | 0.27 | 3.42 | 38% |
| 1971 | 0.86 | 0.03 | 0.00 | 1.37 | 0.10 | 0.13 | 1.02 | 0.42 | 3.93 | 43% |
| 1972 | 1.11 | 0.02 | 0.01 | 1.56 | 0.25 | 0.19 | 0.96 | 0.65 | 4.74 | 43% |
| 1973 | 1.32 | 0.02 | 0.03 | 1.90 | 0.46 | 0.49 | 1.13 | 0.91 | 6.26 | 48% |
| 1974 | 1.07 | 0.01 | 0.02 | 1.76 | 0.71 | 0.46 | 0.98 | 1.10 | 6.11 | 53% |
| 1975 | 0.85 | 0.07 | 0.01 | 1.52 | 0.76 | 0.71 | 0.70 | 1.42 | 6.06 | 59% |
| 1976 | 0.60 | 0.09 | 0.01 | 1.55 | 1.02 | 1.23 | 0.70 | 2.11 | 7.31 | 69% |
| 1977 | 0.52 | 0.18 | 0.01 | 1.91 | 1.14 | 1.38 | 0.69 | 2.98 | 8.81 | 70% |
| 1978 | 0.47 | 0.32 | 0.01 | 1.82 | 0.92 | 1.14 | 0.65 | 3.04 | 8.36 | 69% |
| 1979 | 0.54 | 0.44 | 0.00 | 1.84 | 1.08 | 1.36 | 0.69 | 2.51 | 8.46 | 67% |
| 1980 | 0.45 | 0.53 | 0.00 | 1.62 | 0.86 | 1.26 | 0.48 | 1.70 | 6.91 | 62% |
| 1981 | 0.45 | 0.52 | 0.00 | 1.70 | 0.62 | 1.13 | 0.41 | 1.17 | 6.00 | 55% |
| 1982 | 0.48 | 0.68 | 0.00 | 1.80 | 0.51 | 0.55 | 0.41 | 0.67 | 5.11 | 42% |
| 1983 | 0.55 | 0.83 | 0.00 | 1.81 | 0.30 | 0.34 | 0.42 | 0.80 | 5.05 | 37% |
| 1984 | 0.63 | 0.75 | 0.01 | 2.00 | 0.22 | 0.32 | 0.55 | 0.96 | 5.44 | 38% |
| 1985 | 0.77 | 0.82 | 0.01 | 1.64 | 0.29 | 0.17 | 0.60 | 0.76 | 5.07 | 36% |
| 1986 | 0.81 | 0.70 | 0.02 | 1.86 | 0.44 | 0.68 | 0.79 | 0.92 | 6.22 | 46% |
| 1987 | 0.85 | 0.65 | 0.01 | 2.10 | 0.53 | 0.75 | 0.80 | 0.97 | 6.68 | 46% |
| 1988 | 1.00 | 0.75 | 0.03 | 2.11 | 0.62 | 1.07 | 0.79 | 1.03 | 7.40 | 48% |
| 1989 | 0.93 | 0.77 | 0.05 | 2.17 | 0.82 | 1.22 | 0.87 | 1.23 | 8.06 | 51% |
| 1990 | 0.93 | 0.76 | 0.04 | 1.99 | 0.80 | 1.34 | 1.02 | 1.13 | 8.02 | 54% |
| 1991 | 1.03 | 0.81 | 0.03 | 1.67 | 0.70 | 1.80 | 1.03 | 0.55 | 7.63 | 54% |
| 1992 | 1.07 | 0.83 | 0.02 | 1.88 | 0.68 | 1.72 | 1.17 | 0.52 | 7.89 | 52% |
| 1993 | 1.18 | 0.92 | 0.05 | 2.19 | 0.74 | 1.41 | 1.30 | 0.82 | 8.62 | 50% |
| 1994 | 1.27 | 0.98 | 0.03 | 2.46 | 0.64 | 1.40 | 1.33 | 0.87 | 9.00 | 47% |
| 1995 | 1.33 | 1.07 | 0.02 | 2.41 | 0.63 | 1.34 | 1.48 | 0.55 | 8.83 | 45% |
| 1996 | 1.42 | 1.24 | 0.03 | 2.57 | 0.62 | 1.36 | 1.68 | 0.56 | 9.48 | 44% |
| 1997 | 1.56 | 1.39 | 0.01 | 2.63 | 0.70 | 1.41 | 1.77 | 0.69 | 10.16 | 45% |
| 1998 | 1.60 | 1.35 | 0.02 | 2.83 | 0.70 | 1.49 | 1.72 | 1.00 | 10.71 | 46% |
| 1999 | 1.54 | 1.32 | 0.09 | 2.95 | 0.66 | 1.48 | 1.49 | 1.33 | 10.85 | 46% |
| 2000 | 1.81 | 1.37 | 0.07 | 3.00 | 0.90 | 1.57 | 1.55 | 1.19 | 11.46 | 45% |
| 2001 | 1.83 | 1.44 | 0.09 | 2.98 | 0.89 | 1.66 | 1.55 | 1.43 | 11.87 | 47% |
| 2002 | 1.97 | 1.55 | 0.21 | 3.20 | 0.62 | 1.55 | 1.40 | 1.03 | 11.53 | 40% |
| 2003 | 2.07 | 1.62 | 0.25 | 3.15 | 0.87 | 1.77 | 1.38 | 1.14 | 12.26 | 42% |
| 2004 | 2.14 | 1.66 | 0.30 | 3.34 | 1.14 | 1.56 | 1.55 | 1.45 | 13.15 | 43% |
| 2005 | 2.18 | 1.66 | 0.41 | 3.87 | 1.17 | 1.54 | 1.53 | 1.36 | 13.71 | 41% |
| 2006 | 2.35 | 1.71 | 0.37 | 3.76 | 1.11 | 1.46 | 1.42 | 1.52 | 13.71 | 40% |
| 2007 | 2.45 | 1.53 | 0.41 | 3.09 | 1.13 | 1.48 | 1.36 | 2.00 | 13.47 | 44% |
| 2008 | 2.49 | 1.30 | 0.47 | 2.70 | 0.99 | 1.53 | 1.19 | 2.25 | 12.92 | 46% |
| 2009 | 2.48 | 1.21 | 0.56 | 2.66 | 0.81 | 1.00 | 1.06 | 1.90 | 11.69 | 41% |
| 2010 | 2.54 | 1.28 | 0.61 | 2.46 | 1.02 | 1.10 | 0.99 | 1.80 | 11.79 | 42% |
| 2011 | 2.73 | 1.21 | 0.62 | 2.32 | 0.82 | 1.19 | 0.95 | 1.59 | 11.44 | 40% |
| 2012 | 2.95 | 1.03 | 0.48 | 1.87 | 0.44 | 1.37 | 0.96 | 1.51 | 10.60 | 40% |
| 2013 | 3.13 | 0.92 | 0.46 | 1.58 | 0.28 | 1.33 | 0.80 | 1.30 | 9.79 | 38% |
Notes:
Source: U.S. Energy Information Administration, International Energy Statistics, accessed August 2014.
| ||||||||||