
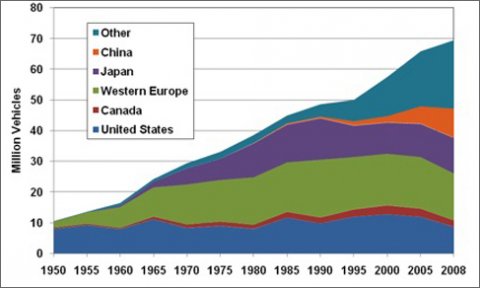
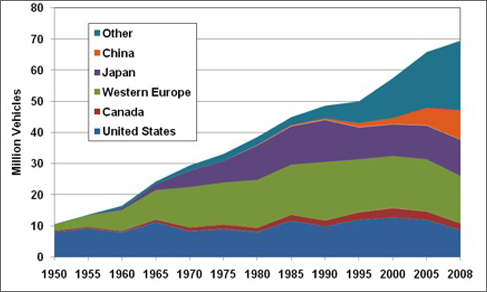
The number of vehicles produced, including cars, trucks, and buses, has risen substantially from 1950 to 2008. In 1950, the majority of the vehicles were produced in the U.S. and Western Europe. In 2008, Japan, China, and other countries around the world produce the majority of vehicles. The U.S. share of world vehicle production declined to 12.5% in 2008.
World Motor Vehicle Production, 1950-2008
Image
Image
Supporting Information
| Year | United States | Canada | Western Europe | Japan | China | Other | World Total | U.S. Share |
|---|---|---|---|---|---|---|---|---|
| 1950 | 8.01 | 0.39 | 1.99 | 0.03 | * | 0.16 | 10.58 | 75.7% |
| 1955 | 9.20 | 0.45 | 3.74 | 0.07 | * | 0.16 | 13.63 | 67.5% |
| 1960 | 7.91 | 0.40 | 6.84 | 0.48 | * | 0.87 | 16.49 | 47.9% |
| 1965 | 11.14 | 0.85 | 9.58 | 1.88 | * | 0.83 | 24.27 | 45.9% |
| 1970 | 8.28 | 1.16 | 13.05 | 5.29 | * | 1.64 | 29.42 | 28.2% |
| 1975 | 8.99 | 1.39 | 13.58 | 6.94 | * | 2.21 | 33.11 | 27.1% |
| 1980 | 8.01 | 1.32 | 15.50 | 11.04 | 0.14 | 2.55 | 38.57 | 20.8% |
| 1985 | 11.65 | 1.93 | 16.11 | 12.27 | 0.44 | 2.50 | 44.91 | 25.9% |
| 1990 | 9.78 | 1.93 | 18.87 | 13.49 | 0.51 | 3.99 | 48.56 | 20.1% |
| 1995 | 11.99 | 2.41 | 17.05 | 10.20 | 1.43 | 6.91 | 49.98 | 24.0% |
| 2000 | 12.77 | 2.96 | 16.75 | 10.15 | 2.07 | 12.73 | 57.43 | 22.2% |
| 2005 | 11.95 | 2.69 | 16.81 | 10.78 | 5.67 | 17.88 | 65.77 | 18.2% |
| 2008 | 8.67 | 2.08 | 15.31 | 11.56 | 9.51 | 22.26 | 69.40 | 12.5% |
* Data for China before 1980 are not available. | ||||||||