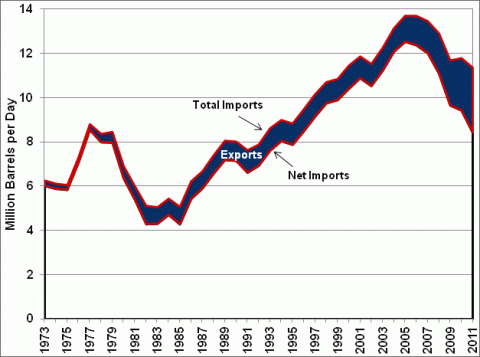
When referring to U.S. imports of petroleum, it is important to make the distinction between total imports and net imports. Net imports are equal to the amount of total imported petroleum minus the petroleum that is exported by the U.S. In the 1970s the difference between total and net imports was minor. However, as the U.S. exports more petroleum, the gap between total imports and net imports grows. In 2011, net imports of petroleum were 44.8% of U.S. petroleum consumption, but total imports of petroleum in 2011 were 60.3% of consumption.
Total Imports, Net Imports, and Exports of Petroleum, 1973-2011
Supporting Information
| Year | Imports | Exports | Net Imports |
|---|---|---|---|
| 1973 | 6.3 | 0.2 | 6.0 |
| 1974 | 6.1 | 0.2 | 5.9 |
| 1975 | 6.1 | 0.2 | 5.8 |
| 1976 | 7.3 | 0.2 | 7.1 |
| 1977 | 8.8 | 0.2 | 8.6 |
| 1978 | 8.4 | 0.4 | 8.0 |
| 1979 | 8.5 | 0.5 | 8.0 |
| 1980 | 6.9 | 0.5 | 6.4 |
| 1981 | 6.0 | 0.6 | 5.4 |
| 1982 | 5.1 | 0.8 | 4.3 |
| 1983 | 5.1 | 0.7 | 4.3 |
| 1984 | 5.4 | 0.7 | 4.7 |
| 1985 | 5.1 | 0.8 | 4.3 |
| 1986 | 6.2 | 0.8 | 5.4 |
| 1987 | 6.7 | 0.8 | 5.9 |
| 1988 | 7.4 | 0.8 | 6.6 |
| 1989 | 8.1 | 0.9 | 7.2 |
| 1990 | 8.0 | 0.9 | 7.2 |
| 1991 | 7.6 | 1.0 | 6.6 |
| 1992 | 7.9 | 0.9 | 6.9 |
| 1993 | 8.6 | 1.0 | 7.6 |
| 1994 | 9.0 | 0.9 | 8.1 |
| 1995 | 8.8 | 0.9 | 7.9 |
| 1996 | 9.5 | 1.0 | 8.5 |
| 1997 | 10.2 | 1.0 | 9.2 |
| 1998 | 10.7 | 0.9 | 9.8 |
| 1999 | 10.9 | 0.9 | 9.9 |
| 2000 | 11.5 | 1.0 | 10.4 |
| 2001 | 11.9 | 1.0 | 10.9 |
| 2002 | 11.5 | 1.0 | 10.5 |
| 2003 | 12.3 | 1.0 | 11.2 |
| 2004 | 13.1 | 1.0 | 12.1 |
| 2005 | 13.7 | 1.2 | 12.5 |
| 2006 | 13.7 | 1.3 | 12.4 |
| 2007 | 13.5 | 1.4 | 12.0 |
| 2008 | 12.9 | 1.8 | 11.1 |
| 2009 | 11.7 | 2.0 | 9.7 |
| 2010 | 11.8 | 2.4 | 9.4 |
| 2011 | 11.4 | 2.9 | 8.4 |
Source: Energy Information Administration, Monthly Energy Review, May 2012, Table 3.3a. | |||


