
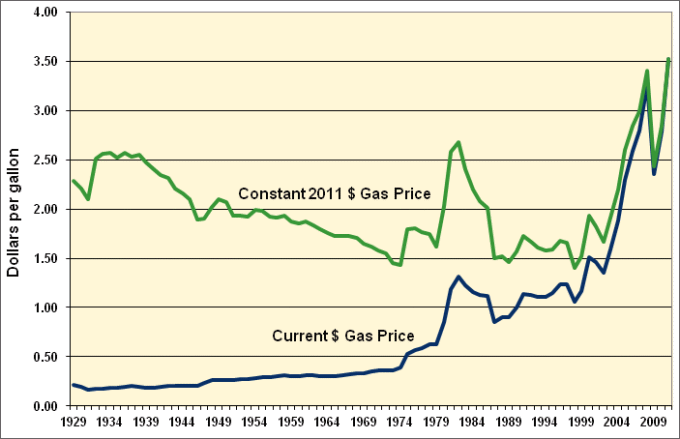
When adjusted for inflation, the average annual price of gasoline in 2011 was $1.24 above the price of gasoline in 1929. The effect of the U.S. embargo of oil from Iran can be seen in the early 1980's with the price of gasoline peaking in 1982. From 2002 to 2008 the price of gasoline rose substantially, but then fell in 2009 during the economic recession. In 2011, prices are the highest in the eighty-year series in both current and constant dollars.
Price of a Gallon of Gasoline, Current and Constant Dollars, 1929-2011
Image

Image
Supporting Information
| Year | Gasoline Price (Current dollars/gallon) | Gasoline Price (Constant 2011 dollars/gallon) |
|---|---|---|
| 1929 | 0.21 | 2.29 |
| 1930 | 0.20 | 2.21 |
| 1931 | 0.17 | 2.10 |
| 1932 | 0.18 | 2.51 |
| 1933 | 0.18 | 2.56 |
| 1934 | 0.19 | 2.57 |
| 1935 | 0.19 | 2.52 |
| 1936 | 0.19 | 2.57 |
| 1937 | 0.20 | 2.53 |
| 1938 | 0.20 | 2.55 |
| 1939 | 0.19 | 2.47 |
| 1940 | 0.18 | 2.40 |
| 1941 | 0.19 | 2.35 |
| 1942 | 0.20 | 2.31 |
| 1943 | 0.21 | 2.20 |
| 1944 | 0.21 | 2.16 |
| 1945 | 0.21 | 2.09 |
| 1946 | 0.21 | 1.90 |
| 1947 | 0.23 | 1.90 |
| 1948 | 0.26 | 2.02 |
| 1949 | 0.27 | 2.09 |
| 1950 | 0.27 | 2.07 |
| 1951 | 0.27 | 1.93 |
| 1952 | 0.27 | 1.93 |
| 1953 | 0.27 | 1.92 |
| 1954 | 0.29 | 1.99 |
| 1955 | 0.29 | 1.98 |
| 1956 | 0.29 | 1.92 |
| 1957 | 0.30 | 1.91 |
| 1958 | 0.31 | 1.94 |
| 1959 | 0.30 | 1.88 |
| 1960 | 0.31 | 1.86 |
| 1961 | 0.31 | 1.87 |
| 1962 | 0.31 | 1.83 |
| 1963 | 0.31 | 1.80 |
| 1964 | 0.30 | 1.76 |
| 1965 | 0.30 | 1.73 |
| 1966 | 0.31 | 1.73 |
| 1967 | 0.32 | 1.72 |
| 1968 | 0.33 | 1.71 |
| 1969 | 0.34 | 1.65 |
| 1970 | 0.35 | 1.62 |
| 1971 | 0.36 | 1.58 |
| 1972 | 0.36 | 1.55 |
| 1973 | 0.36 | 1.45 |
| 1974 | 0.39 | 1.43 |
| 1975 | 0.53 | 1.80 |
| 1976 | 0.57 | 1.81 |
| 1977 | 0.59 | 1.77 |
| 1978 | 0.62 | 1.74 |
| 1979 | 0.63 | 1.62 |
| 1980 | 0.86 | 2.03 |
| 1981 | 1.19 | 2.58 |
| 1982 | 1.31 | 2.68 |
| 1983 | 1.22 | 2.40 |
| 1984 | 1.16 | 2.19 |
| 1985 | 1.13 | 2.08 |
| 1986 | 1.12 | 2.01 |
| 1987 | 0.86 | 1.50 |
| 1988 | 0.90 | 1.52 |
| 1989 | 0.90 | 1.46 |
| 1990 | 1.00 | 1.57 |
| 1991 | 1.14 | 1.73 |
| 1992 | 1.13 | 1.67 |
| 1993 | 1.11 | 1.60 |
| 1994 | 1.11 | 1.58 |
| 1995 | 1.15 | 1.59 |
| 1996 | 1.23 | 1.68 |
| 1997 | 1.23 | 1.65 |
| 1998 | 1.06 | 1.40 |
| 1999 | 1.17 | 1.52 |
| 2000 | 1.51 | 1.93 |
| 2001 | 1.46 | 1.83 |
| 2002 | 1.36 | 1.67 |
| 2003 | 1.59 | 1.92 |
| 2004 | 1.88 | 2.20 |
| 2005 | 2.30 | 2.60 |
| 2006 | 2.59 | 2.84 |
| 2007 | 2.80 | 2.99 |
| 2008 | 3.27 | 3.41 |
| 2009 | 2.35 | 2.43 |
| 2010 | 2.79 | 2.85 |
| 2011 | 3.53 | 3.53 |
| Notes: Retail price includes Federal and State Taxes. Price is for Regular Leaded Gasoline until 1990 and for Regular Unleaded Gasoline thereafter. Constant dollars calculated using the Gross Domestic Product Inflation Index. Source: Energy Information Administration, Annual Energy Review, Table 5.4 and Monthly Energy Review, Table 9.4. | ||