
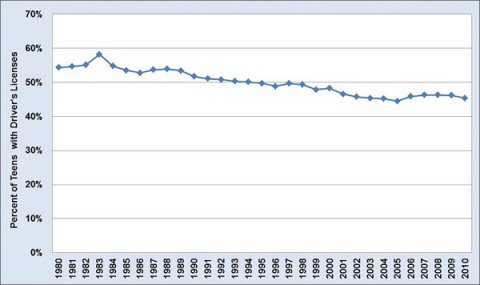
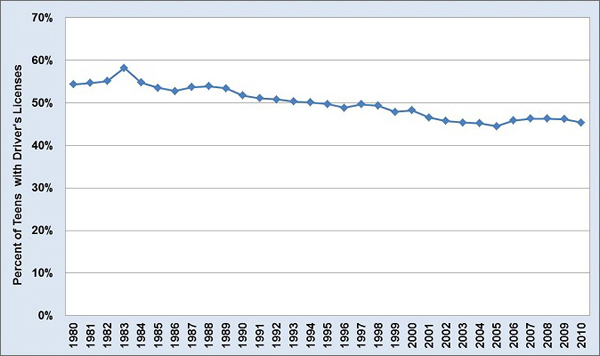
In the 1980's, more than half of all teenagers 15 to 19 years old had a driver's license. But that has changed. Since 1995, less than half of that age group has a driver's license. In 2010, the latest year for which data are available, only 45.3% of 15 to 19 year-olds had a license. There are many different reasons that this has happened. Some states have placed more stringent requirements on those applying for a license. For example, the State of Tennessee requires anyone less than 18 years of age to provide proof that they are currently attending school in order to obtain a driver's license. Among other reasons, the connectivity of the Internet may give teens less of an incentive to pursue a license, or the high costs of operating a vehicle may be prohibitive, thus obtaining a license is delayed.
Share of 15 to 19 Year-Olds with Driver's Licenses, 1980-2010
Image
Supporting Information
| Year | Number of Licensed Drivers 19 Years Old and Under | U.S. Population of 15-19 Year-Olds | Drivers as a Percent of Age Group |
|---|---|---|---|
| 1980 | 11,496,000 | 21,168,000 | 54.3% |
| 1981 | 11,215,000 | 20,541,000 | 54.6% |
| 1982 | 10,993,000 | 19,962,000 | 55.1% |
| 1983 | 11,280,000 | 19,388,000 | 58.2% |
| 1984 | 10,366,000 | 18,931,000 | 54.8% |
| 1985 | 10,011,000 | 18,727,000 | 53.5% |
| 1986 | 9,920,751 | 18,813,000 | 52.7% |
| 1987 | 10,034,302 | 18,698,000 | 53.7% |
| 1988 | 9,964,531 | 18,496,000 | 53.9% |
| 1989 | 9,674,286 | 18,133,000 | 53.4% |
| 1990 | 9,249,046 | 17,893,000 | 51.7% |
| 1991 | 8,813,928 | 17,270,000 | 51.0% |
| 1992 | 8,749,553 | 17,246,000 | 50.7% |
| 1993 | 8,781,080 | 17,474,000 | 50.3% |
| 1994 | 8,948,793 | 17,876,000 | 50.1% |
| 1995 | 9,124,125 | 18,374,000 | 49.7% |
| 1996 | 9,234,000 | 18,920,000 | 48.8% |
| 1997 | 9,626,945 | 19,398,000 | 49.6% |
| 1998 | 9,782,763 | 19,840,000 | 49.3% |
| 1999 | 9,610,142 | 20,085,000 | 47.8% |
| 2000 | 9,743,519 | 20,219,000 | 48.2% |
| 2001 | 9,420,642 | 20,262,000 | 46.5% |
| 2002 | 9,298,258 | 20,348,000 | 45.7% |
| 2003 | 9,263,217 | 20,446,000 | 45.3% |
| 2004 | 9,333,086 | 20,677,000 | 45.1% |
| 2005 | 9,337,290 | 20,994,000 | 44.5% |
| 2006 | 9,727,516 | 21,246,000 | 45.8% |
| 2007 | 9,920,174 | 21,446,000 | 46.3% |
| 2008 | 9,953,935 | 21,514,000 | 46.3% |
| 2009 | 9,932,441 | 21,538,000 | 46.1% |
| 2010 | 9,556,240 | 21,086,000 | 45.3% |
| Sources: Licensed Drivers - U.S. Department of Transportation, Federal Highway Administration, Highway Statistics 2010, Washington, D.C., September 2011, Table DL-20 and annual. Population - Bureau of the Census, Statistical Abstract of the United States. | |||