
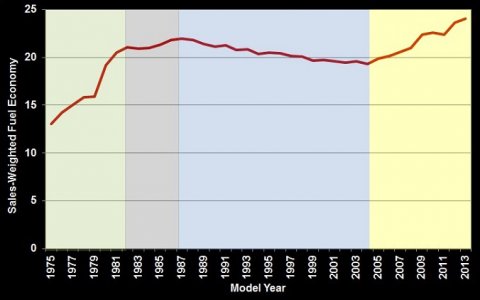
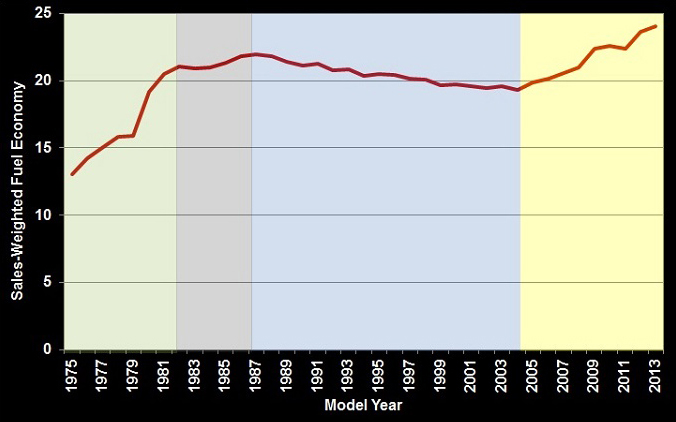
The sales-weighted fuel economy average of all light vehicles sold in model year (MY) 2013 was 1.6 miles per gallon (mpg) higher than MY 2011. This increase brings the new light vehicle fuel economy average to 24 mpg for the first time since the Environmental Protection Agency (EPA) began recording new vehicle fuel economy data in 1975. According to the EPA, fuel economy has moved through four phases over the years:
New Light Vehicle Fuel Economy, 1975-2013
Image
Image
Supporting Information
| Model Year | Miles per Gallon |
|---|---|
| 1975 | 13.1 |
| 1976 | 14.2 |
| 1977 | 15.1 |
| 1978 | 15.8 |
| 1979 | 15.9 |
| 1980 | 19.2 |
| 1981 | 20.5 |
| 1982 | 21.1 |
| 1983 | 21.0 |
| 1984 | 21.0 |
| 1985 | 21.3 |
| 1986 | 21.8 |
| 1987 | 22.0 |
| 1988 | 21.9 |
| 1989 | 21.4 |
| 1990 | 21.2 |
| 1991 | 21.2 |
| 1992 | 20.8 |
| 1993 | 20.9 |
| 1994 | 20.4 |
| 1995 | 20.5 |
| 1996 | 20.4 |
| 1997 | 20.1 |
| 1998 | 20.1 |
| 1999 | 19.7 |
| 2000 | 19.8 |
| 2001 | 19.6 |
| 2002 | 19.4 |
| 2003 | 19.6 |
| 2004 | 19.3 |
| 2005 | 19.9 |
| 2006 | 20.1 |
| 2007 | 20.6 |
| 2008 | 21.0 |
| 2009 | 22.4 |
| 2010 | 22.6 |
| 2011 | 22.4 |
| 2012 | 23.6 |
| 2013 | 24.0 |
| Note: Fuel economy data are sales-weighted EPA adjusted values. Source: U.S. EPA, Light-Duty Automotive Technology, Carbon Dioxide Emissions, and Fuel Economy Trends: 1975 Through 2013. | |