
From January 2013 through March 2020, the month-to-month changes in average used light-duty vehicle prices were between -1.9% and 0.4%, but since that time used vehicle prices have experienced more significant swings.
August 1, 2022From January 2013 through March 2020, the month-to-month changes in average used light-duty vehicle prices were between -1.9% and 0.4%, but since that time used vehicle prices have experienced more significant swings. For example, in April 2021 used vehicle prices appreciated 5.5% over the previous month. Pandemic disruptions, new vehicle sales reductions, economic uncertainty, mode switching (from transit), inflation, and interest rate changes are all factors that have contributed to the large month-to-month changes in used light-duty vehicle prices.
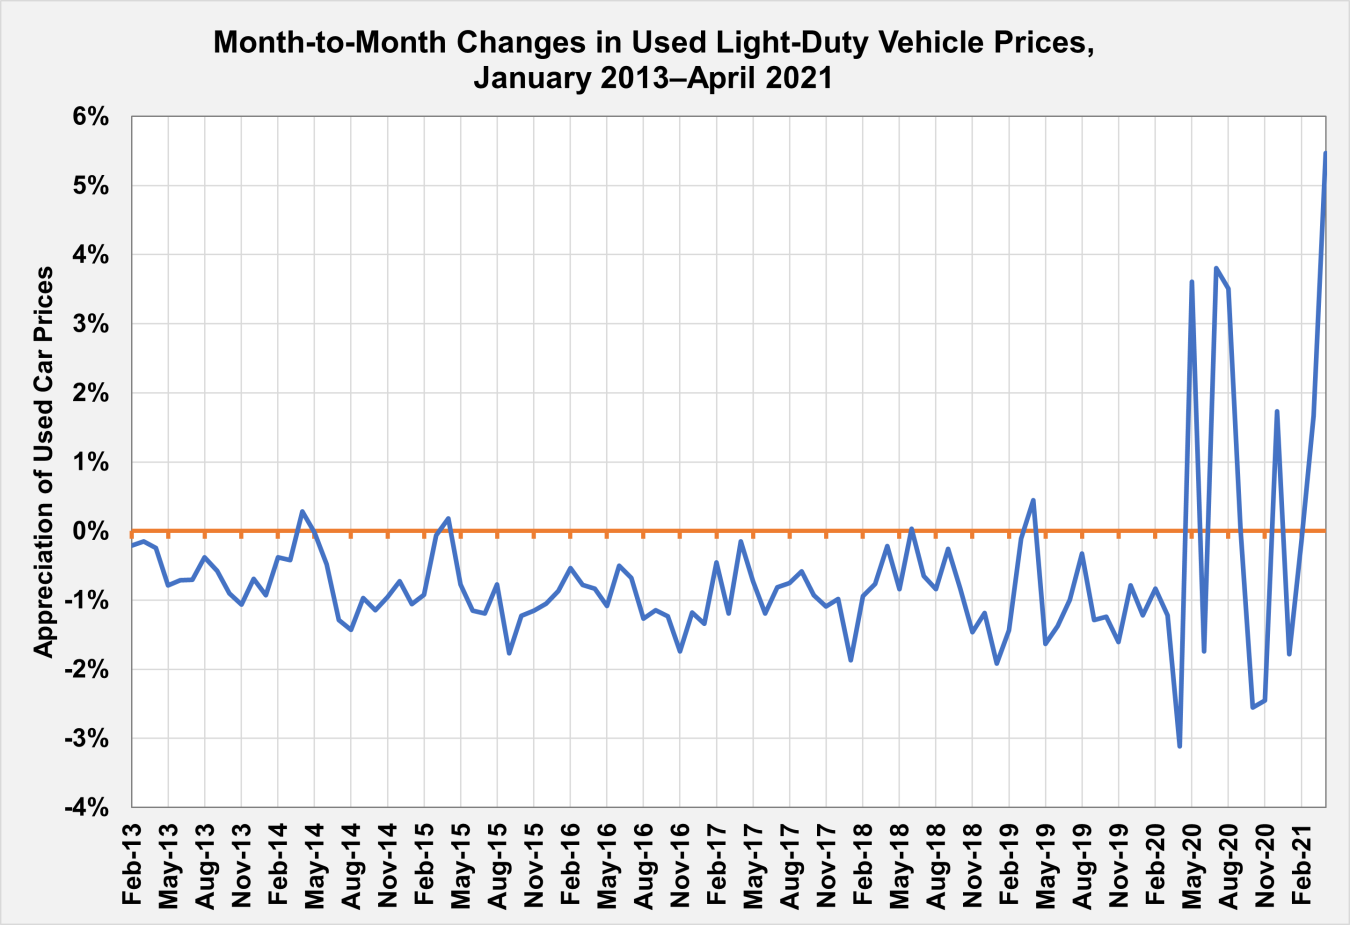
Note: Includes light-duty vehicles from model years 2010‒2021.
Source: Rush, Luke, Zhou, Yan, and Gohlke, David, Vehicle Residual Value Analysis by Powertrain Type and Impacts on Total Cost of Ownership, 2022.