
This article is the second in a series of communication pieces associated with the Manufacturing Energy and Carbon Footprints project from the U.S. Department of Energy Advanced Manufacturing Office.
Advanced Manufacturing & Industrial Decarbonization
May 20, 2022This article is the second in a series of communication pieces associated with the Manufacturing Energy and Carbon Footprints project from the U.S. Department of Energy Advanced Manufacturing Office.
Manufacturing Energy and Carbon Footprints map the flow of energy supply, demand, and losses as well as greenhouse gas (GHG) emissions in diverse U.S. manufacturing industries. The footprints are based on the U.S. Energy Information Administration’s (EIA) Manufacturing Energy Consumption Survey (MECS), along with referenced energy loss and emissions factors, and input from industry and subject matter experts.
Fuel consumption in the manufacturing sector
An overall decrease in fuel consumption between 2002 and 2018 is observed, Figure 1 (note: feedstock consumption is not included in this analysis). A 13% decrease in fuel consumption is observed between 2002 and 2010. A 5% growth in fuel consumption is observed between 2010 and 2014, followed by relatively stable consumption between 2014 and 2018.
Figure 2 summarizes the trends in energy consumption by type (note: feedstock consumption is not included in this analysis).
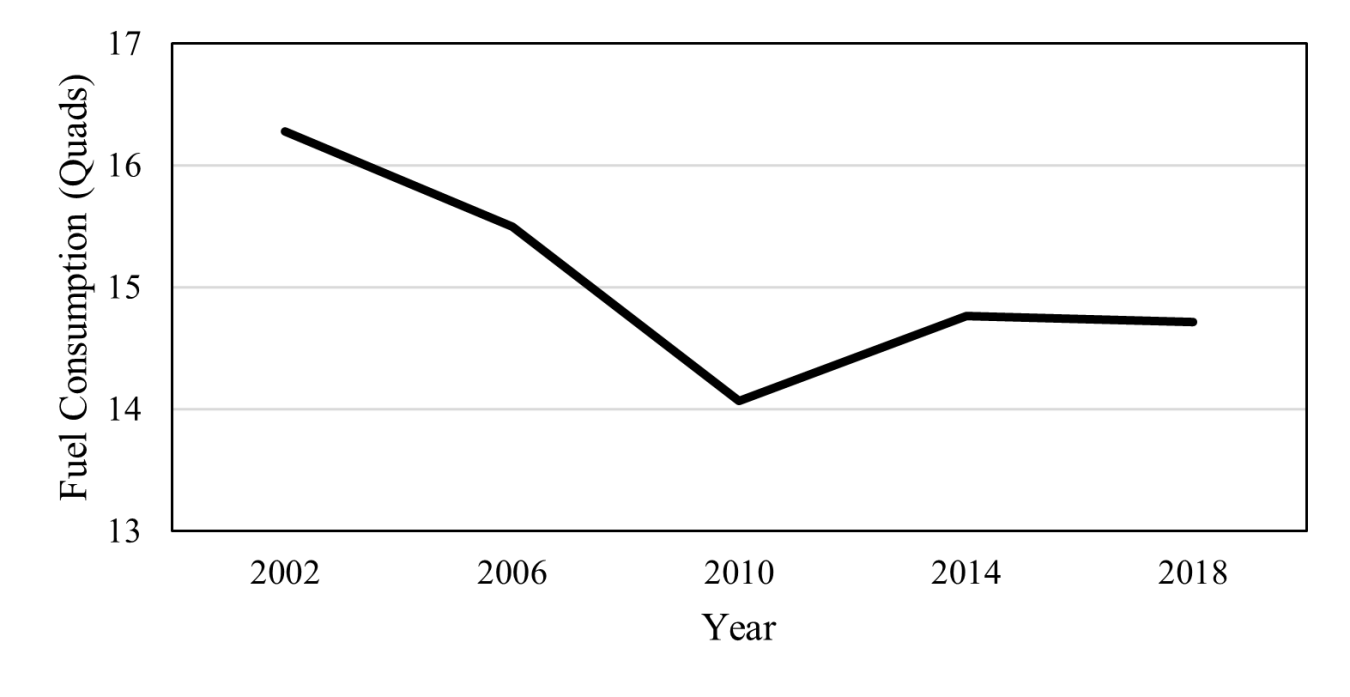
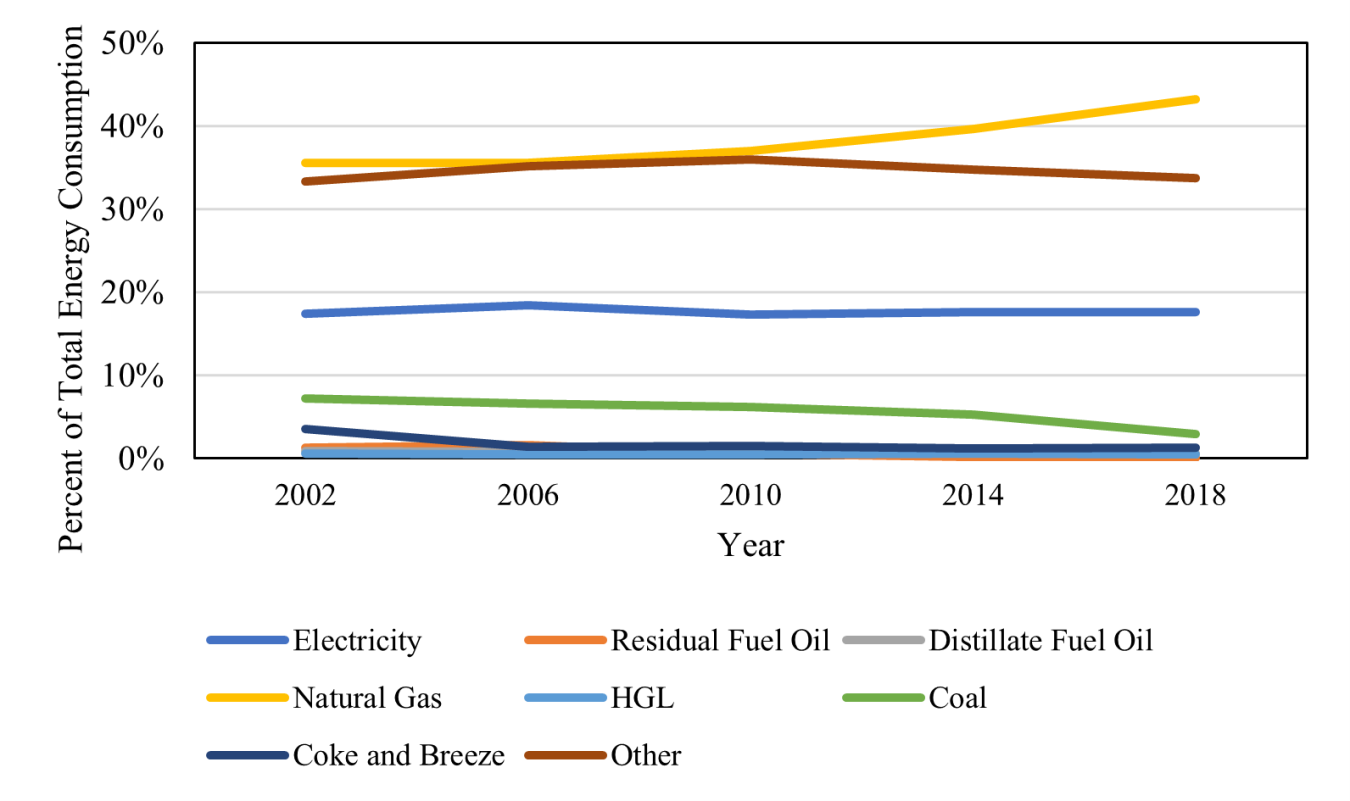
Figure 2: Electricity and fuel consumption in the manufacturing sector between 2002 and 2018. “Other” fuels, representing roughly a third of all fuel consumption, constitutes fuels such as waste gas, petroleum coke, biomass, and blast furnace gas (EIA 2021a).
Natural gas has been and continues to be the primary source of fuel for the manufacturing sector. From 2002 to 2018, the share of natural gas use increased roughly 8%, while all other fuel types decreased or stayed stable.
Looking specifically at the carbon-intensive fuels, large decreases between 2002 and 2018 are observed, Figure 3 and Figure 4.

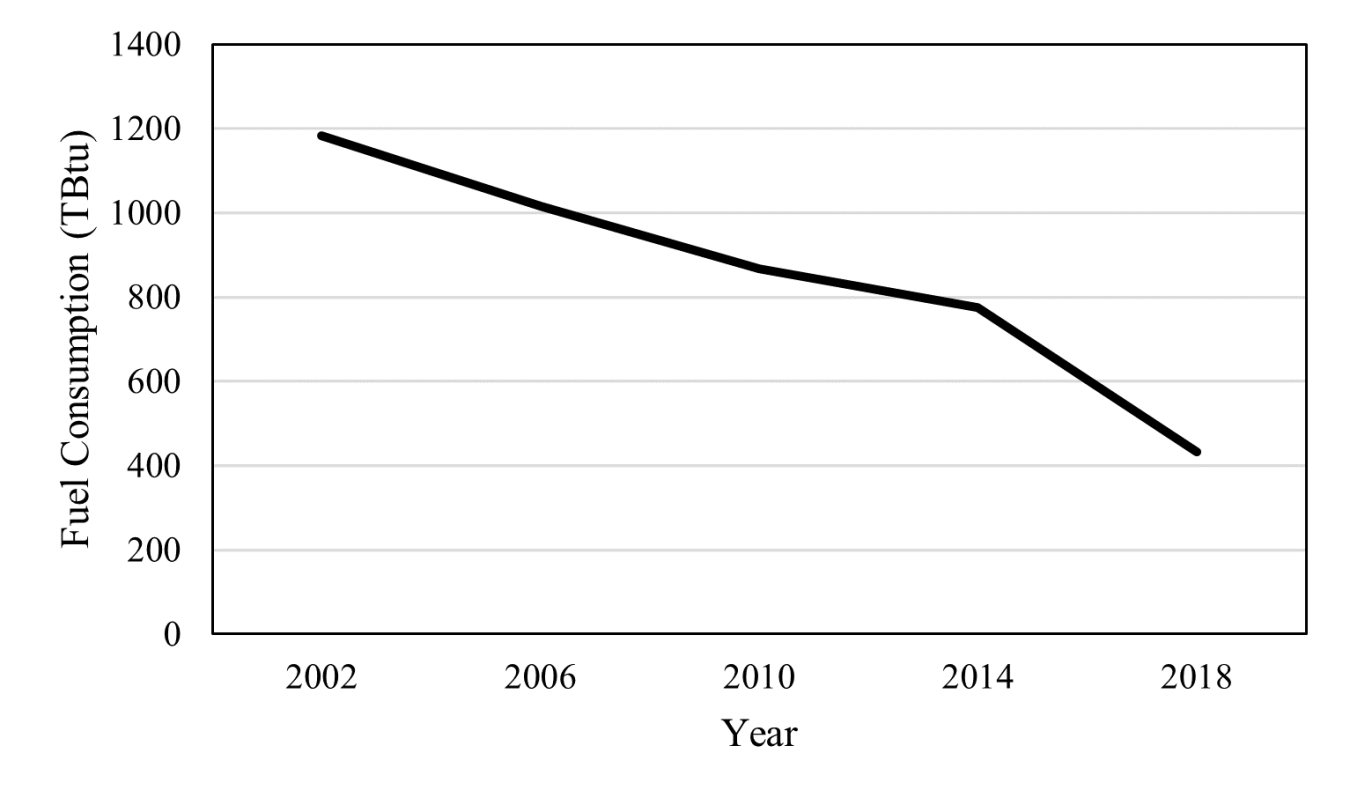
Figure 3: Coal consumption in U.S. manufacturing between 2002 and 2018 (EIA 2021a).
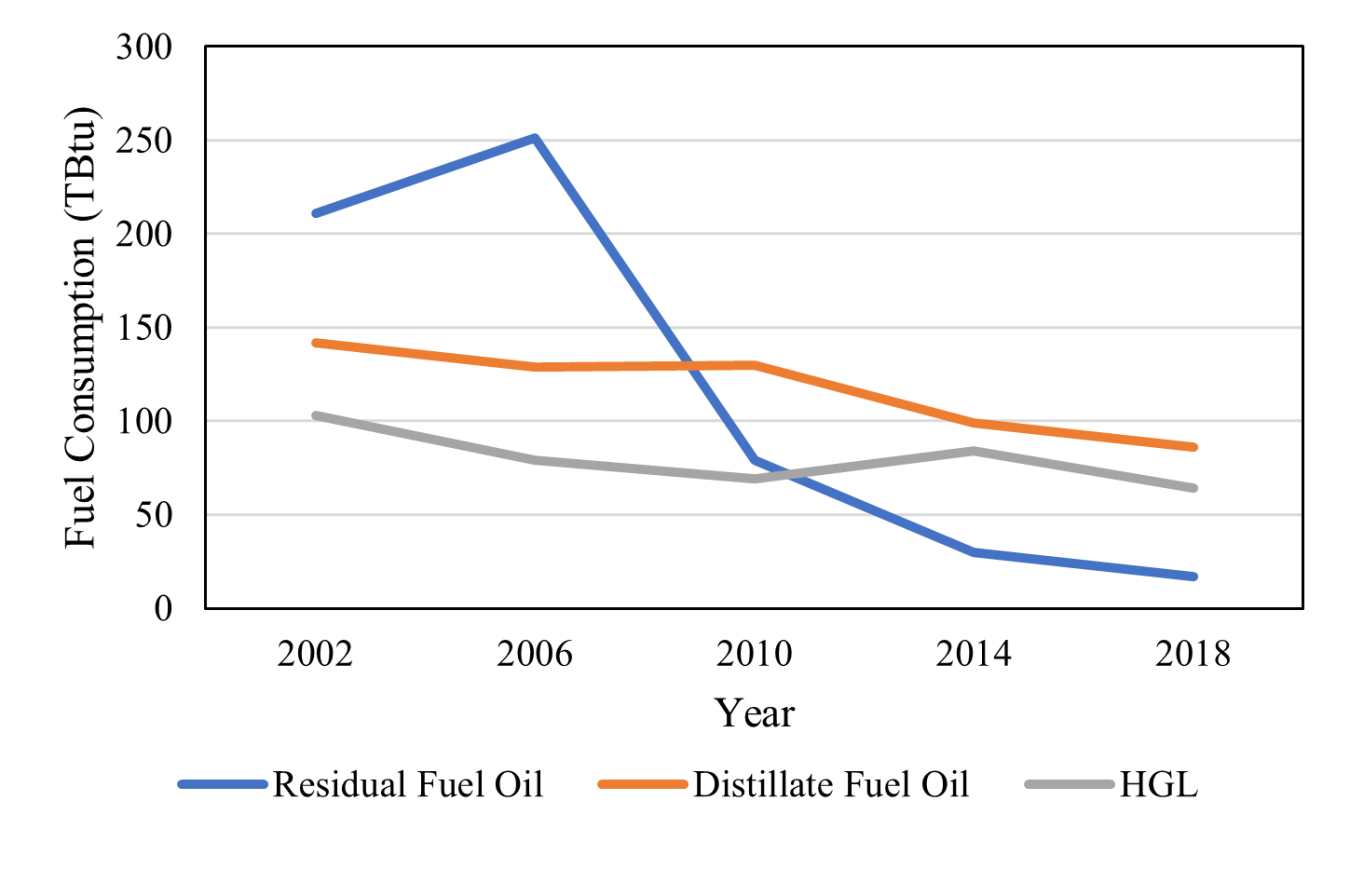
Figure 4: Consumption of residual and distillate fuel oil and HGL in U.S. manufacturing between 2002 and 2018 (EIA 2021a).
Consumption of coal, residual fuel oils, distillate fuel oils and hydrocarbon gas liquids (HGL) – such as propane and butane – decreased by 63%, 93%, 39%, and 38%, respectively, between 2002 and 2018.
On the other hand, electricity usage and onsite electricity generation in the manufacturing sector has remained relatively stable since 2002 as shown in Figure 5.
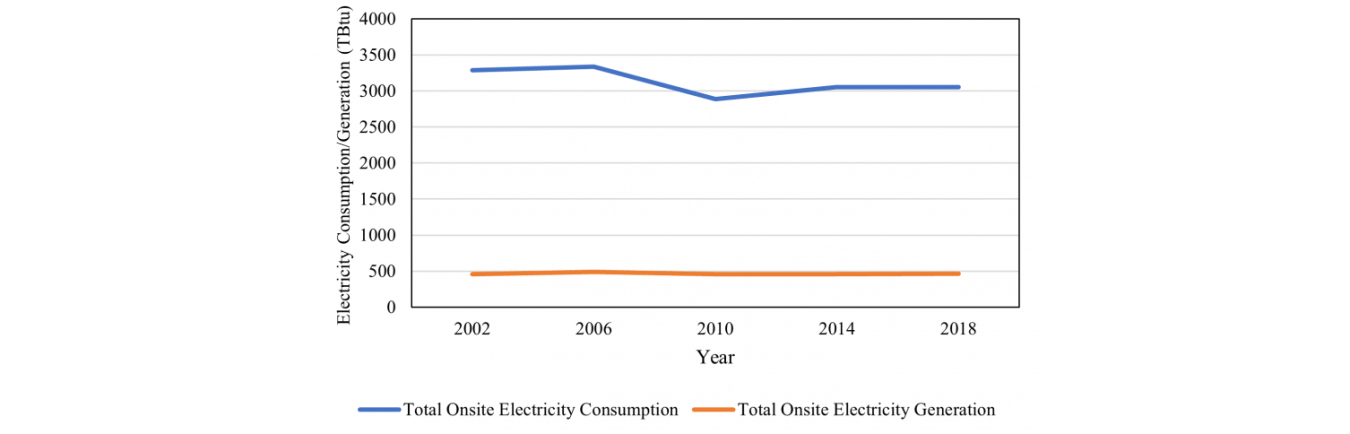
Figure 5: Onsite electricity consumption and generation in the manufacturing sector from 2002 to 2018 (EIA 2021a).
Looking closer at 2018 MECS data, Figure 6 summarizes end-use fuel and electricity consumption.
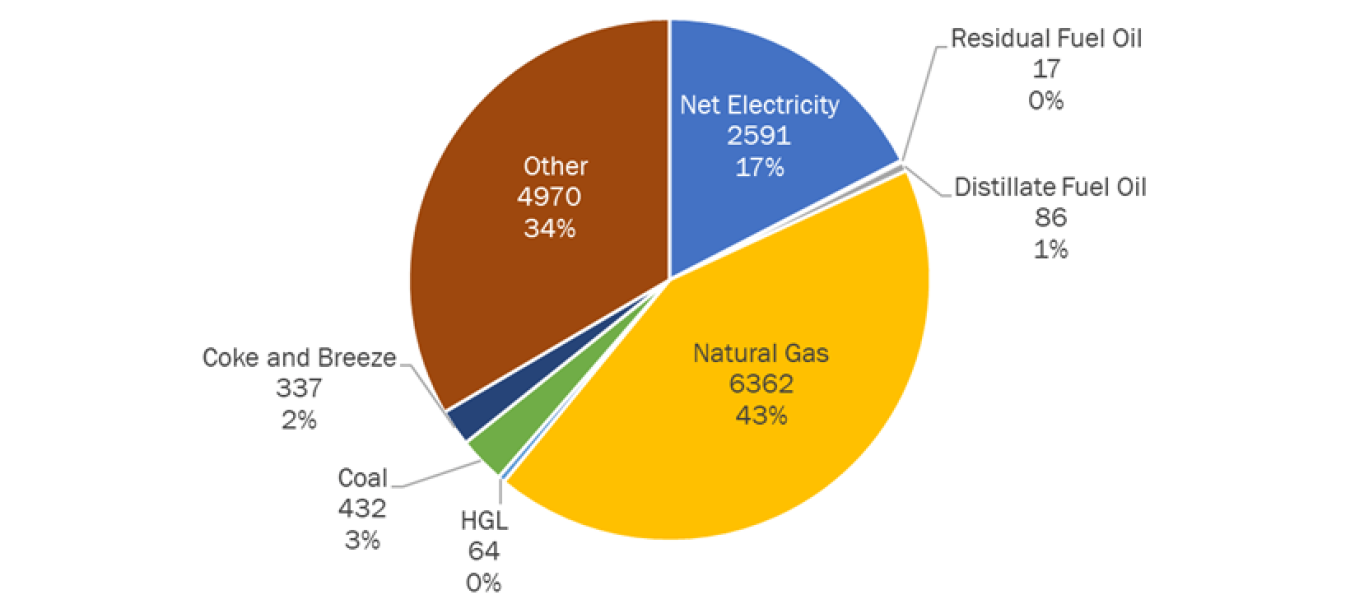
Figure 6: End-use fuel and electricity consumption of the manufacturing sector in 2018. Total energy consumed as fuel was 14,859 TBtu. (EIA 2021a)
Allocation of energy to specific end uses for 2018 are summarized in Table 1.
Table 1: Allocation of fuel, electricity, and steam to manufacturing end uses in 2018 (EIA 2021a, 2021b)
| End Use | % Fuel | % Electricity | % Steam |
| Conventional Boiler Use | 97% | 3% | 0% |
| Combined Heat and Power (CHP) and/or Cogeneration Process | 100% | 0% | 0% |
| Indirect Uses-Boiler Fuel | 99% | 1% | 0% |
| Process Heating | 66% | 4% | 30% |
| Process Cooling and Refrigeration | 8% | 68% | 24% |
| Machine Drive | 11% | 73% | 16% |
| Electro-Chemical Processes | 0% | 100% | 0% |
| Other Process Use | 53% | 11% | 36% |
| Direct Uses-Total Process | 51% | 22% | 27% |
| Facility Heating, Ventilation, and Air Conditioning (HVAC) | 41% | 26% | 33% |
| Facility Lighting | 0% | 100% | 0% |
| Other Facility Support | 49% | 51% | 0% |
| Onsite Transportation | 78% | 22% | 0% |
| Conventional Electricity Generation | 100% | 0% | 0% |
| Other Non-process Use | 12% | 9% | 78% |
| Direct Uses-Total Non-process | 38% | 34% | 28% |
| Total All End Uses | 64% | 17% | 19% |
As Table 1 shows, fuel is still the primary energy input for a majority end uses.
Applied Energy
Analysis of MECS data is only one piece of the larger Manufacturing Energy and Carbon Footprints effort. Losses associated with generation, including transmission and distribution, and system and equipment losses must be estimated to complete the Footprints analysis. Once both generation and end use losses are accounted for, applied energy, the share of primary energy input that is applied to process and non-process end uses, can be calculated. Figure 7 depicts the breakdown of applied energy and loss for the 2018 Footprints analysis. A future article will provide a holistic discussion of the 2018 Footprints analysis results.

Figure 7: Primary energy by loss and applied energy in U.S. manufacturing in 2018. Total primary energy input was 19,663 TBtu (AMO 2022).
References
DOE (Department of Energy). 2022. Manufacturing Energy and Carbon Footprints. /eere/amo/manufacturing-energy-and-carbon-footprints-2018-mecs
EIA (Energy Information Administration). 2021a. Manufacturing Energy Consumption Survey (MECS). “Table 3.2 Energy Consumption as a Fuel By Manufacturing Industry and Region (trillion Btu).” https://www.eia.gov/consumption/manufacturing/data/2018/
———. 2021b. Manufacturing Energy Consumption Survey (MECS). “Table 1.5 Consumption of Energy for All Purposes (First Use) By Further Classification of ‘Other’ Energy Sources.” https://www.eia.gov/consumption/manufacturing/data/2018/
EPA (Environmental Protection Agency). 2021. Greenhouse Gas Equivalencies Calculator. https://www.epa.gov/energy/greenhouse-gas-equivalencies-calculator