
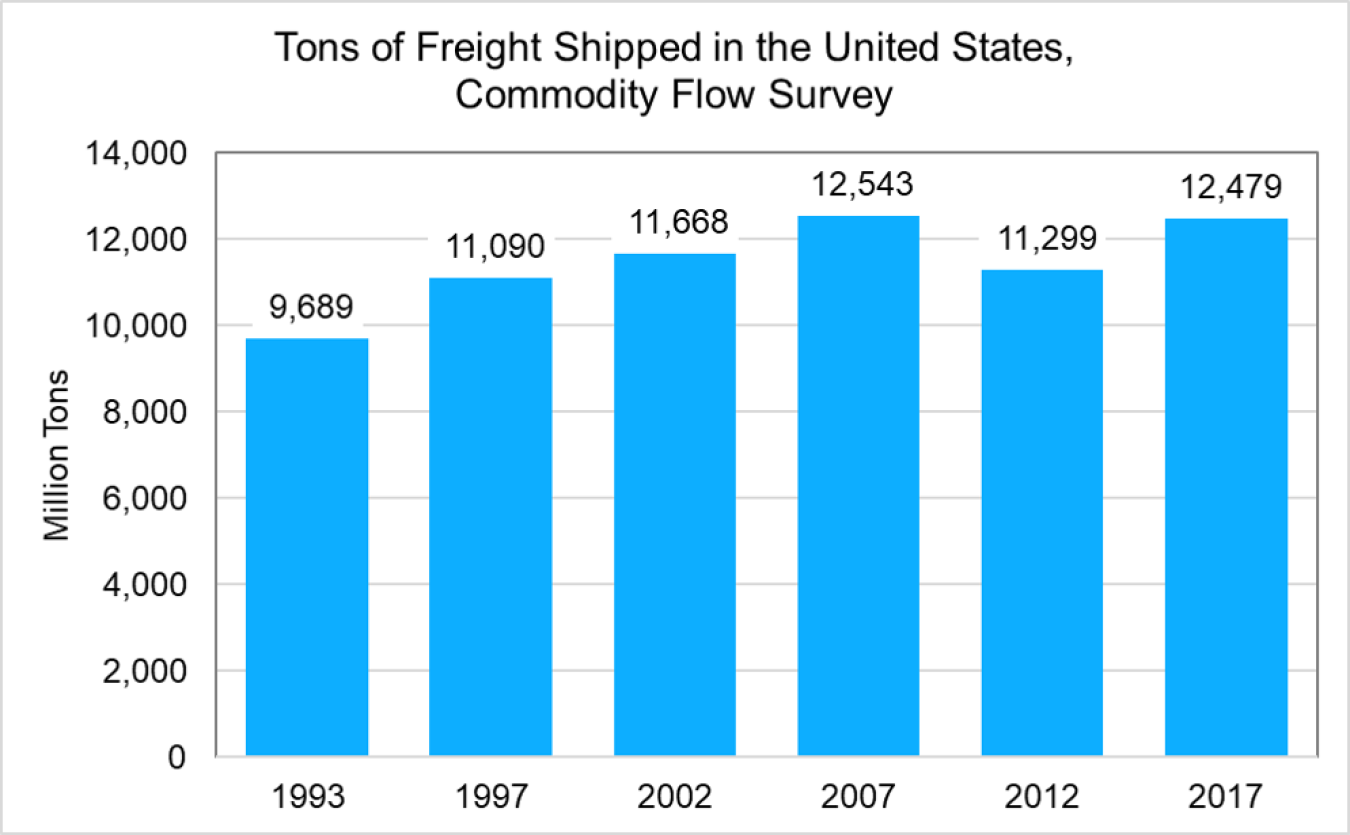
The preliminary data from the 2017 Commodity Flow Survey shows a 10% increase in the number of freight tons moved in the U.S. compared to 2012.
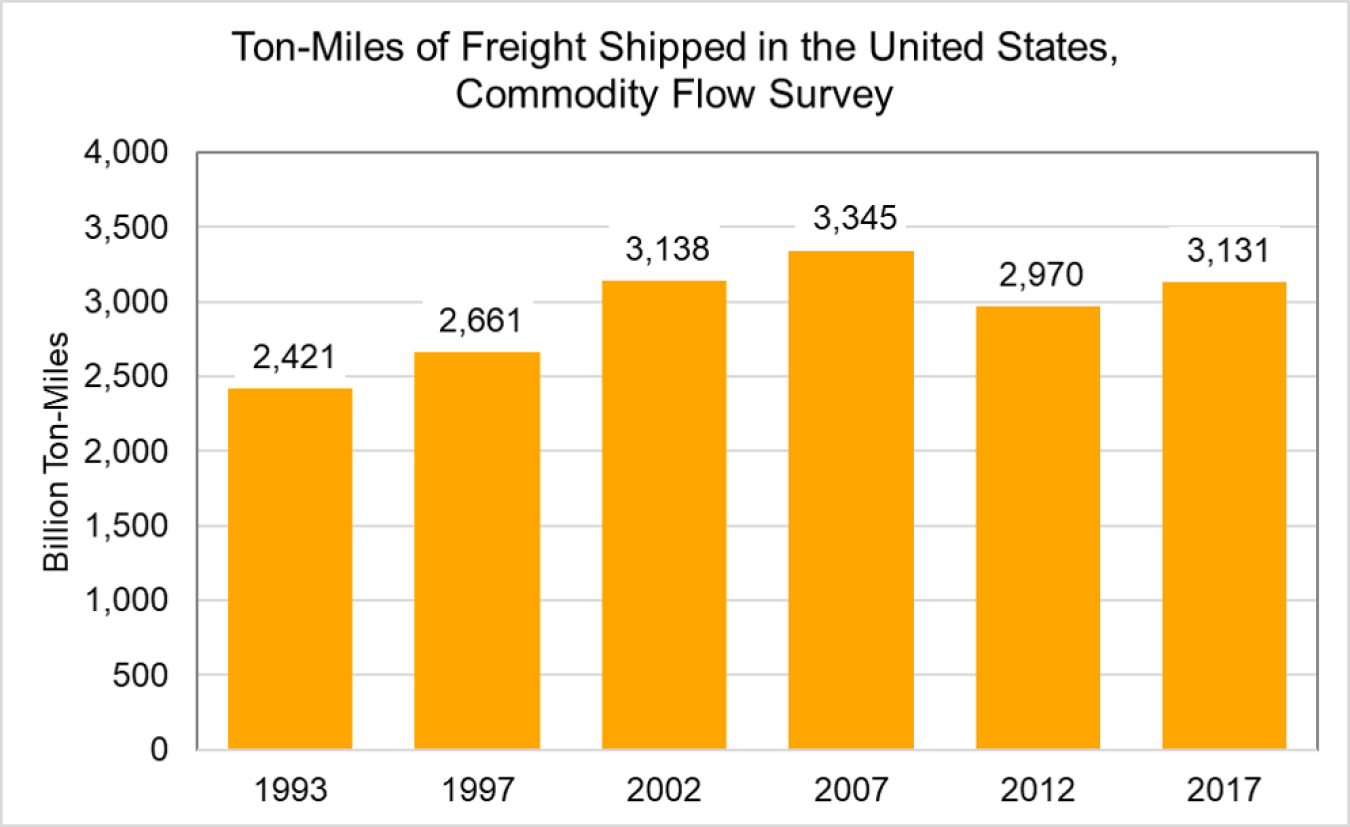
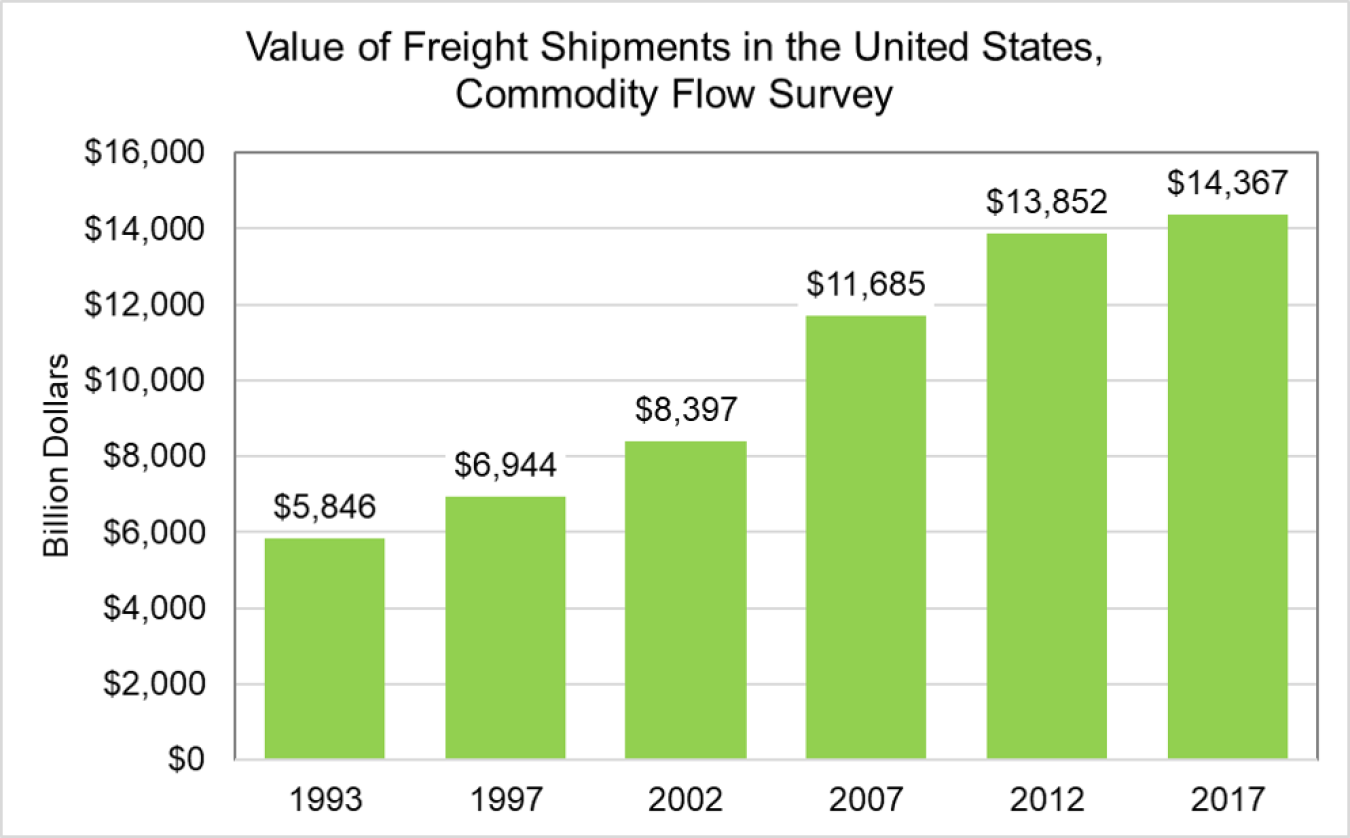
February 11, 2019The recently released preliminary data from the 2017 Commodity Flow Survey (CFS) shows a 10% increase in the number of freight tons moved in the United States from the last survey, which was conducted in 2012; ton-miles increased by 5% and value increased by 4%. The number of tons and ton-miles increased from the 1993 survey to the 2007 survey, but declined in 2012, likely due to declines in freight movement during the Great Recession in 2009. Freight value (not adjusted for inflation) showed an increasing trend each year.
Notes:
Ton-miles are the shipment weight multiplied by the mileage traveled by the shipment.
The CFS collects data from shipping establishments across the United States in mining, manufacturing, wholesale, and select retail and services trade industries (e.g., electronic shopping and mail-order houses, fuel dealers, and publishers), and auxiliary establishments such as warehouses and managing offices. For more information on the CFS, see the CFS FAQs.
Source: U.S. Department of Transportation, Bureau of Transportation Statistics and U.S. Census Bureau, 2017 Commodity Flow Survey, Table 1.