
Photo
Caption
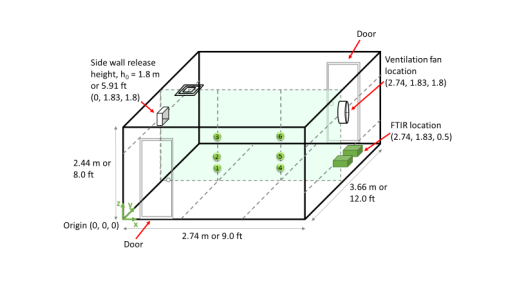
Figure 1: Schematic of test room showing refrigerant release and concentration measurement locations (points 1-6), vents and doors.
Photo
Caption
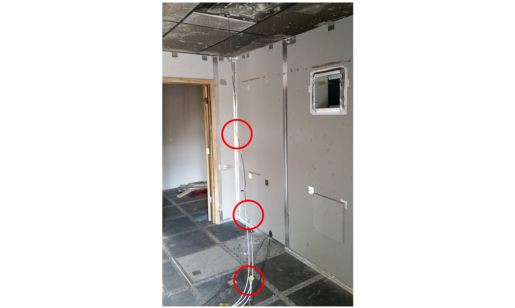
Figure 2: Test room set up at Jenson Hughes, Inc.; refrigerant release diffuser at upper right and concentration measurement tree (points 1-3, circled) just to left of access door.
Photo
Caption
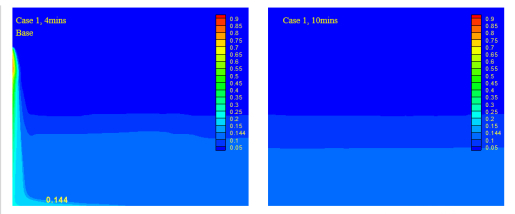
Figure 3: CFD simulation results of flammable refrigerant concentration at mid-plane of room: (left side) at end of refrigerant release period, 4-min into simulation; (right side) 10 minutes after refrigerant release starts
Photo
Caption
Figure 1: Schematic of test room showing refrigerant release and concentration measurement locations (points 1-6), vents and doors.
Figure 1: Schematic of test room showing refrigerant release and concentration measurement locations (points 1-6), vents and doors.