
SUBSCRIBE to the Fact of the Week
The Environmental Protection Agency divides sport utility vehicles (SUV) into car SUV and truck SUV based on size and the number of drive wheels. Altogether, the two classes accounted for 34% of light vehicle production in model year (MY) 2016. In MY 1975, about 80% of the vehicles produced were cars. The share of cars (blue area) was generally shrinking until 2003 and since that time has been around 50% of light vehicle production.
Light Vehicle Production Shares by Vehicle Class, MY 1975-2016
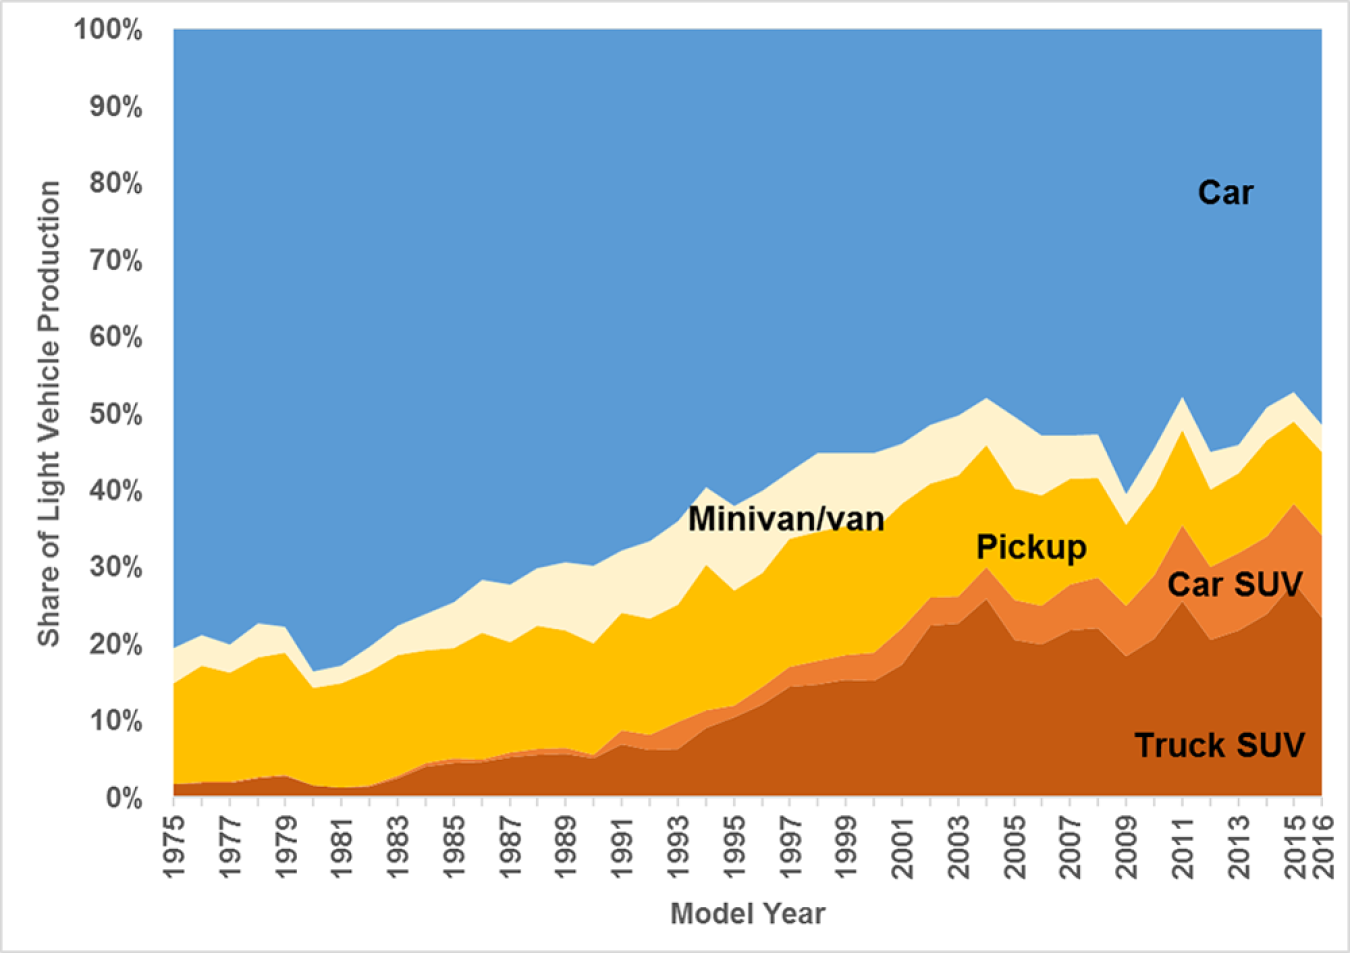
Note: MY 2016 data are preliminary.
To see a list of vehicles in the car SUV category, see Table 4.9 in the Transportation Energy Data Book: Edition 35.
Supporting Information
| Model Year | Car | Car SUV | Truck SUV | Pickup | Minivan/Van |
|---|---|---|---|---|---|
| 1975 | 80.6% | 0.1% | 1.7% | 13.1% | 4.5% |
| 1976 | 78.8% | 0.1% | 1.9% | 15.1% | 4.1% |
| 1977 | 80.0% | 0.1% | 1.9% | 14.3% | 3.6% |
| 1978 | 77.3% | 0.1% | 2.5% | 15.7% | 4.3% |
| 1979 | 77.8% | 0.1% | 2.8% | 15.9% | 3.5% |
| 1980 | 83.5% | 0.0% | 1.6% | 12.7% | 2.1% |
| 1981 | 82.7% | 0.0% | 1.3% | 13.6% | 2.3% |
| 1982 | 80.3% | 0.1% | 1.5% | 14.8% | 3.2% |
| 1983 | 77.7% | 0.3% | 2.5% | 15.8% | 3.7% |
| 1984 | 76.1% | 0.4% | 4.1% | 14.6% | 4.8% |
| 1985 | 74.6% | 0.6% | 4.5% | 14.4% | 5.9% |
| 1986 | 71.7% | 0.4% | 4.6% | 16.5% | 6.8% |
| 1987 | 72.2% | 0.6% | 5.2% | 14.4% | 7.5% |
| 1988 | 70.2% | 0.7% | 5.6% | 16.1% | 7.4% |
| 1989 | 69.3% | 0.7% | 5.7% | 15.4% | 8.8% |
| 1990 | 69.8% | 0.5% | 5.1% | 14.5% | 10.0% |
| 1991 | 67.8% | 1.8% | 6.9% | 15.3% | 8.2% |
| 1992 | 66.6% | 2.0% | 6.2% | 15.1% | 10.0% |
| 1993 | 64.0% | 3.6% | 6.3% | 15.2% | 10.9% |
| 1994 | 59.6% | 2.3% | 9.1% | 18.9% | 10.0% |
| 1995 | 62.0% | 1.5% | 10.5% | 15.0% | 11.0% |
| 1996 | 60.0% | 2.2% | 12.2% | 14.9% | 10.7% |
| 1997 | 57.6% | 2.5% | 14.5% | 16.7% | 8.8% |
| 1998 | 55.1% | 3.1% | 14.7% | 16.7% | 10.3% |
| 1999 | 55.1% | 3.2% | 15.4% | 16.7% | 9.6% |
| 2000 | 55.1% | 3.7% | 15.2% | 15.8% | 10.2% |
| 2001 | 53.9% | 4.8% | 17.3% | 16.1% | 7.9% |
| 2002 | 51.5% | 3.7% | 22.3% | 14.8% | 7.7% |
| 2003 | 50.2% | 3.6% | 22.6% | 15.7% | 7.8% |
| 2004 | 48.0% | 4.1% | 25.9% | 15.9% | 6.1% |
| 2005 | 50.5% | 5.1% | 20.6% | 14.5% | 9.3% |
| 2006 | 52.9% | 5.0% | 19.9% | 14.5% | 7.7% |
| 2007 | 52.9% | 6.0% | 21.7% | 13.8% | 5.5% |
| 2008 | 52.7% | 6.6% | 22.1% | 12.9% | 5.7% |
| 2009 | 60.5% | 6.5% | 18.4% | 10.6% | 4.0% |
| 2010 | 54.5% | 8.2% | 20.7% | 11.5% | 5.0% |
| 2011 | 47.8% | 10.0% | 25.5% | 12.3% | 4.3% |
| 2012 | 55.0% | 9.4% | 20.6% | 10.1% | 4.9% |
| 2013 | 54.1% | 10.0% | 21.8% | 10.4% | 3.8% |
| 2014 | 49.2% | 10.1% | 23.9% | 12.4% | 4.3% |
| 2015 | 47.2% | 10.2% | 28.1% | 10.7% | 3.9% |
| 2016 | 51.4% | 10.7% | 23.4% | 10.8% | 3.6% |
Source: U.S. Environmental Protection Agency, Light-Duty Automotive Technology, Carbon Dioxide Emissions, and Fuel Economy Trends Report: 1975 Through 2016 November 2016, EPA-420-R-16-010, Table 3.1. | |||||