
SUBSCRIBE to the Fact of the Week
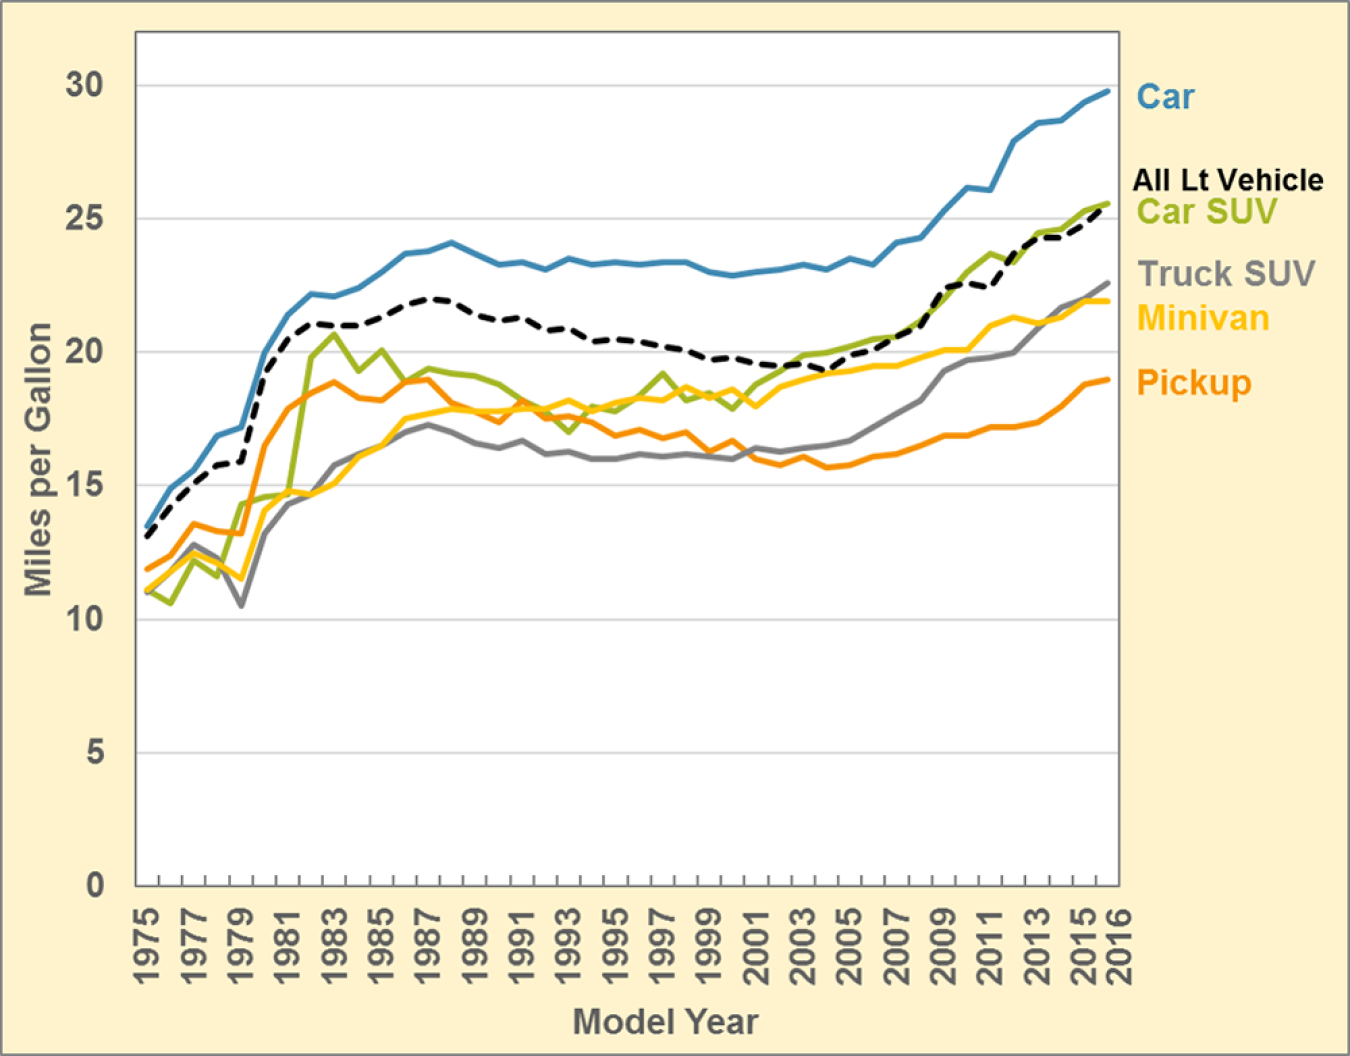
The fuel economy of new light vehicles has generally risen since 2004 and reached an all-time high of 25.6 miles per gallon in model year (MY) 2016. The production-weighted average fuel economy of three of the vehicle classes – cars, car sport utility vehicles (SUVs), and truck SUVs – had never been higher than in MY 2016. For pickups and minivans, the MY 2016 average fuel economy reached the same level as a previous high. Car SUVs experienced a 131% improvement in fuel economy from MY 1975 to 2016 – the largest improvement of any vehicle class. Overall, pickups had the smallest fuel economy improvement of the vehicle classes (60%) likely due to changes in size and power of pickups sold over the time period shown.
New Light Vehicle Fuel Economy by Vehicle Class, MY 1975-2016
Notes:
- Model year 2016 data are preliminary.
- To see a list of vehicles in the car SUV category, see Table 4.9 in the Transportation Energy Data Book: Edition 35.
- Average fuel economy is the production-weighted harmonic mean.
Supporting Information
| Model Year | Fuel Economy (Miles per Gallon) | |||||
|---|---|---|---|---|---|---|
| Car | Car SUV | Pickup | Truck SUV | Minivan/van | All Light Vehicles | |
| 1975 | 13.5 | 11.1 | 11.9 | 11.0 | 11.1 | 13.1 |
| 1976 | 14.9 | 10.6 | 12.4 | 11.8 | 11.8 | 14.2 |
| 1977 | 15.6 | 12.2 | 13.6 | 12.8 | 12.5 | 15.1 |
| 1978 | 16.9 | 11.6 | 13.3 | 12.3 | 12.1 | 15.8 |
| 1979 | 17.2 | 14.3 | 13.2 | 10.5 | 11.5 | 15.9 |
| 1980 | 20.0 | 14.6 | 16.5 | 13.2 | 14.1 | 19.2 |
| 1981 | 21.4 | 14.7 | 17.9 | 14.3 | 14.8 | 20.5 |
| 1982 | 22.2 | 19.8 | 18.5 | 14.7 | 14.7 | 21.1 |
| 1983 | 22.1 | 20.7 | 18.9 | 15.8 | 15.1 | 21.0 |
| 1984 | 22.4 | 19.3 | 18.3 | 16.2 | 16.1 | 21.0 |
| 1985 | 23.0 | 20.1 | 18.2 | 16.5 | 16.5 | 21.3 |
| 1986 | 23.7 | 18.9 | 18.9 | 17.0 | 17.5 | 21.8 |
| 1987 | 23.8 | 19.4 | 19.0 | 17.3 | 17.7 | 22.0 |
| 1988 | 24.1 | 19.2 | 18.1 | 17.0 | 17.9 | 21.9 |
| 1989 | 23.7 | 19.1 | 17.8 | 16.6 | 17.8 | 21.4 |
| 1990 | 23.3 | 18.8 | 17.4 | 16.4 | 17.8 | 21.2 |
| 1991 | 23.4 | 18.2 | 18.2 | 16.7 | 17.9 | 21.3 |
| 1992 | 23.1 | 17.8 | 17.5 | 16.2 | 17.9 | 20.8 |
| 1993 | 23.5 | 17.0 | 17.6 | 16.3 | 18.2 | 20.9 |
| 1994 | 23.3 | 18.0 | 17.4 | 16.0 | 17.8 | 20.4 |
| 1995 | 23.4 | 17.8 | 16.9 | 16.0 | 18.1 | 20.5 |
| 1996 | 23.3 | 18.4 | 17.1 | 16.2 | 18.3 | 20.4 |
| 1997 | 23.4 | 19.2 | 16.8 | 16.1 | 18.2 | 20.2 |
| 1998 | 23.4 | 18.2 | 17.0 | 16.2 | 18.7 | 20.1 |
| 1999 | 23.0 | 18.5 | 16.3 | 16.1 | 18.3 | 19.7 |
| 2000 | 22.9 | 17.9 | 16.7 | 16.0 | 18.6 | 19.8 |
| 2001 | 23.0 | 18.8 | 16.0 | 16.4 | 18.0 | 19.6 |
| 2002 | 23.1 | 19.3 | 15.8 | 16.3 | 18.7 | 19.5 |
| 2003 | 23.3 | 19.9 | 16.1 | 16.4 | 19.0 | 19.6 |
| 2004 | 23.1 | 20.0 | 15.7 | 16.5 | 19.2 | 19.3 |
| 2005 | 23.5 | 20.2 | 15.8 | 16.7 | 19.3 | 19.9 |
| 2006 | 23.3 | 20.5 | 16.1 | 17.2 | 19.5 | 20.1 |
| 2007 | 24.1 | 20.6 | 16.2 | 17.7 | 19.5 | 20.6 |
| 2008 | 24.3 | 21.2 | 16.5 | 18.2 | 19.8 | 21.0 |
| 2009 | 25.3 | 22.0 | 16.9 | 19.3 | 20.1 | 22.4 |
| 2010 | 26.2 | 23.0 | 16.9 | 19.7 | 20.1 | 22.6 |
| 2011 | 26.1 | 23.7 | 17.2 | 19.8 | 21.0 | 22.4 |
| 2012 | 27.9 | 23.4 | 17.2 | 20.0 | 21.3 | 23.7 |
| 2013 | 28.6 | 24.5 | 17.4 | 20.9 | 21.1 | 24.3 |
| 2014 | 28.7 | 24.6 | 18.0 | 21.7 | 21.3 | 24.3 |
| 2015 | 29.4 | 25.3 | 18.8 | 22.0 | 21.9 | 24.8 |
| 2016 | 29.8 | 25.6 | 19.0 | 22.6 | 21.9 | 25.6 |
Source: U.S. Environmental Protection Agency, Light-Duty Automotive Technology, Carbon Dioxide Emissions, and Fuel Economy Trends Report: 1975 Through 2016, November 2016, EPA-420-R-16-010, Tables 2.1 and 3.1. | ||||||