
SUBSCRIBE to the Fact of the Week
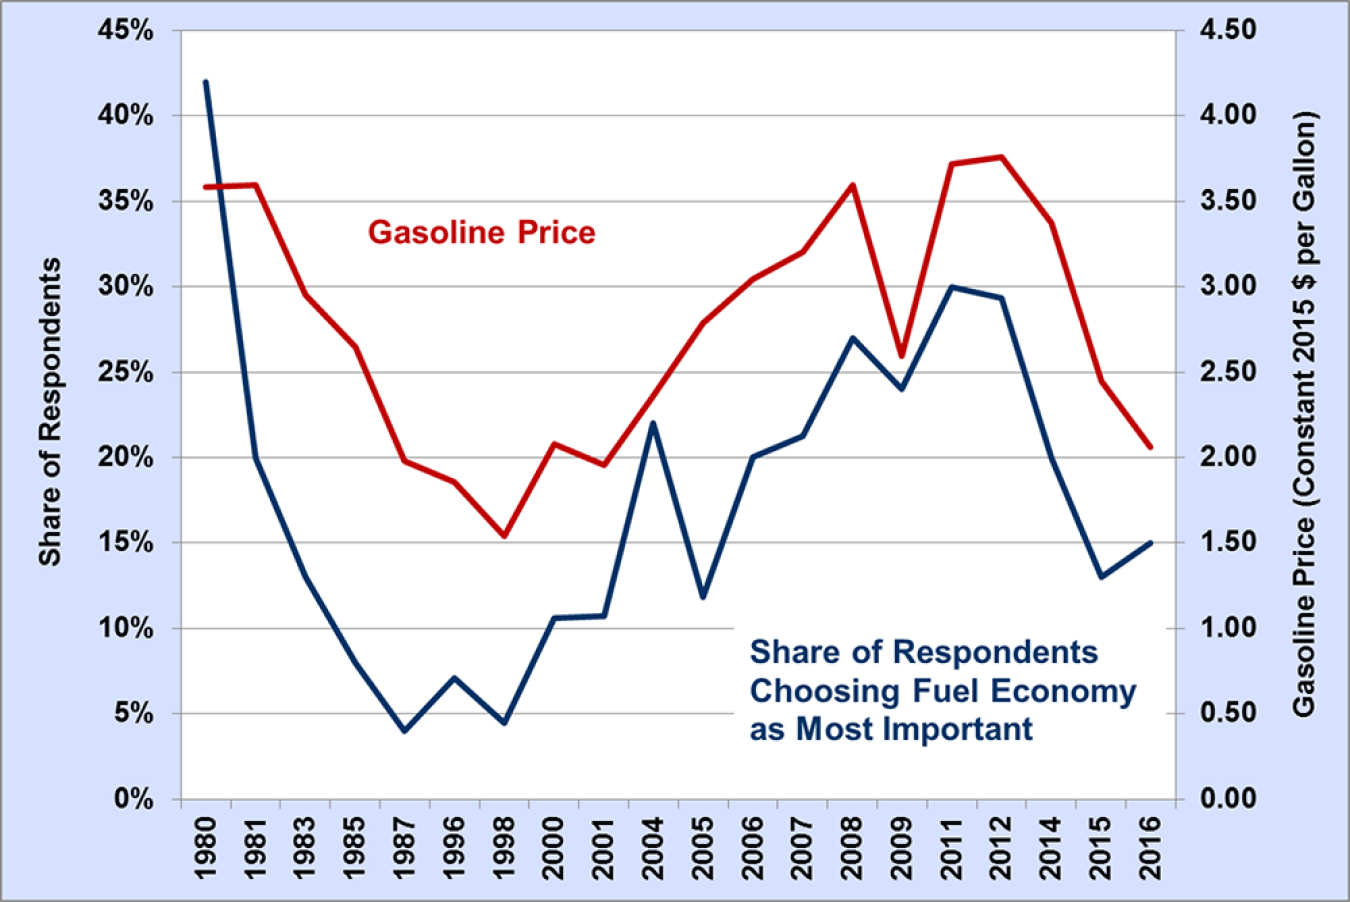
For over 25 years, surveys of the general U.S. population have gauged consumer sentiments on vehicle qualities. A 2016 survey of the general population asked “Which one of the following attributes would be most important in your choice of your next vehicle?” The share of respondents choosing fuel economy as most important was highest in 1980, 2011, and 2012. The average annual gasoline price in those years was over $3.50 per gallon (measured in constant 2015 dollars to adjust for inflation). In 1985 and 1998, the years in which the fewest respondents chose fuel economy as an important attribute, the price of gasoline was less than $2.00 per gallon. Gasoline prices declined in 2015 and 2016, and the share of respondents choosing fuel economy as an important attribute was the lowest since 2005 (13% and 15%, respectively).
Fuel Economy as the Most Important Vehicle Attribute Compared to Gasoline Price, 1980-2016
Supporting Information
| Year | Fuel Economy | Gasoline Price (Constant 2015 Dollars per Gallon) |
|---|---|---|
| 1980 | 42% | 3.58 |
| 1981 | 20% | 3.59 |
| 1983 | 13% | 2.95 |
| 1985 | 8% | 2.65 |
| 1987 | 4% | 1.98 |
| 1996 | 7% | 1.86 |
| 1998 | 4% | 1.54 |
| 2000 | 11% | 2.08 |
| 2001 | 11% | 1.96 |
| 2004 | 22% | 2.36 |
| 2005 | 12% | 2.79 |
| 2006 | 20% | 3.04 |
| 2007 | 21% | 3.20 |
| 2008 | 27% | 3.60 |
| 2009 | 24% | 2.60 |
| 2011 | 30% | 3.72 |
| 2012 | 29% | 3.76 |
| 2014 | 20% | 3.37 |
| 2015 | 13% | 2.45 |
| 2016 | 15% | 2.06 |
Notes: Fuel economy was chosen by survey respondents asked this question: Which one of the following attributes would be most important in your choice of your next vehicle? Gasoline prices are annual averages for regular unleaded gasoline. Sources: 1996-2016: Opinion Research Corporation International for the National Renewable Energy Laboratory (based on the general population). National Renewable Energy Laboratory, Consumer Views on Transportation and Advanced Vehicle Technologies, NREL/TP-5400-64840, September 2015, Figure 11. National Renewable Energy Laboratory, Consumer Views on Transportation and Energy (Third Edition), NREL/TP-620-39047, January 2006, Table 4.1.1. | ||