
SUBSCRIBE to the Fact of the Week
Monthly plug-in vehicle (PEV) sales are small in comparison to total vehicle sales, but PEV sales shares are growing within some size classes. Looking at six-month moving totals, subcompact PEV sales were 4% of all subcompact sales from September 2014 to February 2015 and after an early-year decline rose to 3.7% by late 2015 despite falling gasoline prices. Large PEV sales were 1.4% of all large car sales in early 2014, but rose to 2.5% by the July to December 2015 period. The compact car and standard SUV categories posted overall gains during this timeframe. Midsize PEV sales, which include the Nissan Leaf, fell from a high of 2.6% of all midsize sales in mid-2014 to 1.5% by December 2015.
Share of PEV Sales to All Sales in Size Class, and Gasoline Prices,
June 2014 - December 2015
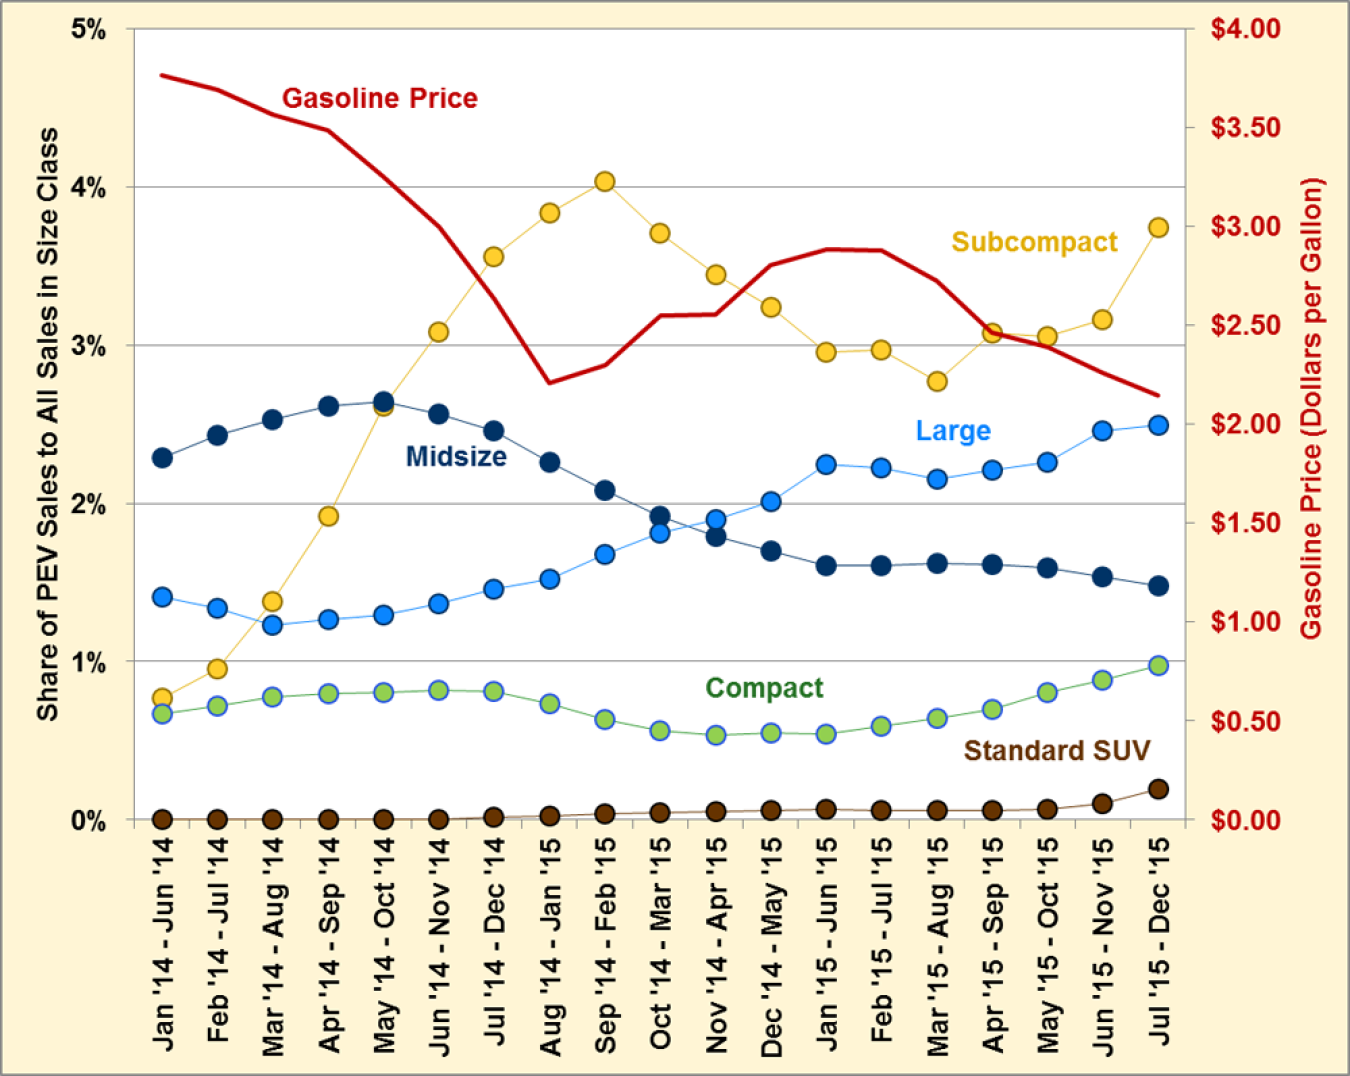
Note: The "Shares of PEV Sales to All Sales in Size Class" are six-month moving totals, which helps to adjust for seasonal variation and provide data smoothing.
| Vehicle Size Class | Make/Model |
|---|---|
| Subcompact | Mitsubishi iMiEV BMW Active E Chevrolet Spark Cadillac ELR BMW i3 BMW i8 |
| Compact | Chevrolet Volt Ford Focus VW e-Golf Audi A3 Plug In |
| Midsize | Nissan Leaf Prius PHEV Ford C-Max Energi Honda Accord Ford Fusion Energi Mercedes B-Class Hyundai Sonata Plug In |
| Large | Tesla Model S Porsche Panamera S E-Hybrid Mercedes S550 Plug |
| Standard SUV | Porsche Cayenne S E-hybrid Volvo-XC90 Plug In Tesla Model X BMW X5 |
Supporting Information
| Month-Year | Share of PEV Sales to All Sales in Size Class | Regular Gasoline Price (Dollars per Gallon) | ||||
|---|---|---|---|---|---|---|
| Subcompact | Compact | Midsize | Large | Standard SUV (4WD) | ||
| Jan '14 - Jun '14 | 0.77% | 0.67% | 2.29% | 1.41% | 0.00% | $3.77 |
| Feb '14 - Jul '14 | 0.95% | 0.72% | 2.43% | 1.34% | 0.00% | $3.69 |
| Mar '14 - Aug '14 | 1.38% | 0.78% | 2.53% | 1.23% | 0.00% | $3.57 |
| Apr '14 - Sep '14 | 1.92% | 0.80% | 2.61% | 1.27% | 0.00% | $3.48 |
| May '14 - Oct '14 | 2.61% | 0.80% | 2.64% | 1.30% | 0.00% | $3.26 |
| Jun '14 - Nov '14 | 3.08% | 0.82% | 2.57% | 1.36% | 0.01% | $3.00 |
| Jul '14 - Dec '14 | 3.56% | 0.81% | 2.46% | 1.46% | 0.01% | $2.63 |
| Aug '14 - Jan '15 | 3.83% | 0.73% | 2.26% | 1.52% | 0.02% | $2.21 |
| Sep '14 - Feb '15 | 4.03% | 0.63% | 2.08% | 1.68% | 0.04% | $2.30 |
| Oct '14 - Mar '15 | 3.71% | 0.56% | 1.92% | 1.81% | 0.04% | $2.55 |
| Nov '14 - Apr '15 | 3.44% | 0.53% | 1.79% | 1.90% | 0.05% | $2.56 |
| Dec '14 - May '15 | 3.24% | 0.55% | 1.70% | 2.01% | 0.06% | $2.80 |
| Jan '15 - Jun '15 | 2.95% | 0.54% | 1.61% | 2.25% | 0.06% | $2.89 |
| Feb '15 - Jul '15 | 2.97% | 0.59% | 1.61% | 2.22% | 0.06% | $2.88 |
| Mar '15 - Aug '15 | 2.77% | 0.64% | 1.62% | 2.15% | 0.06% | $2.73 |
| Apr '15 - Sep '15 | 3.07% | 0.70% | 1.61% | 2.21% | 0.06% | $2.46 |
| May '15 - Oct '15 | 3.06% | 0.81% | 1.59% | 2.26% | 0.06% | $2.39 |
| Jun '15 - Nov '15 | 3.16% | 0.88% | 1.54% | 2.46% | 0.10% | $2.26 |
| Jul '15 - Dec '15 | 3.74% | 0.97% | 1.48% | 2.49% | 0.19% | $2.14 |
Sources: PEV data provided by Yan Zhou, Argonne National Laboratory, Light Duty Electric Drive Vehicles Monthly Sales Updates, May 2016. | ||||||